If you’re running your own DNS resolver you’re probably interested in some benchmark tests against it, such as: how fast does my own server (read: Raspberry Pi) answer to common DNS queries compared to 8.8.8.8.
In this blogpost I am showing how to use two tools for testing/benchmarking DNS resolvers: namebench & dnseval. I am listing the defaults, giving some hints about them and showing examples in which I tested some private and public DNS resolvers: a Fritzbox router, a Raspberry Pi with Unbound, Quad9, OpenDNS, and Google Public DNS.
namebench
Namebench is an open-source DNS benchmark utility listed at Google Code Archive. You can install it on any Ubuntu-like Linux with sudo apt-get install namebench. The config files are at /etc/namebench/ while certain lists that are used by the program are here: /usr/share/namebench/data/. It ships with a GUI but I prefer the usage through the CLI. Be careful: Without any options it immediately starts testing some (many!) servers. For information about its options you must use the -h switch: namebench -h.
Namebench has a couple of input sources while the most interesting ones are “alexa“, “cachehit” and “cachemiss“. While the first one queries different FQDNs out of a built-in Alexa list the other two options test exactly what the names imply: either cache hits (by only querying the same name again and again) or cache misses by querying random names for which the DNS resolver must first look up the record itself before delivering it to the client.
Note that the “cache-hit.txt” file which is used for the cachehit procedure queries the A record of “a.root-servers.net.”. In my test cases (below) this made a difference compared to some other DNS queries. I am not quite sure why but I suppose that this is related to some built-in lists for the root servers into the DNS resolvers. For example, Unbound has a “root.hints” file which holds the A and AAAA records for them. Hence, this file is queried rather than the cache itself. In my examples I changed the content of the file which changed the test results dramatically as well!
Furthermore note that namebench does some kind of sanity checks which are completely outdated. I commented out any sanity lines within the sudo nano hostname_reference.cfg file to get rid of the warnings in the results. These are not correct anymore since the offered service such as Twitter or PayPal use other A records nowadays.
A sample command of namebench looks like that which uses the alexa input source and tests the Google Public DNS server:
|
1 |
namebench --no_gui --input=alexa --only 2001:4860:4860::8888 |
The results are stored at /tmp/ such as /tmp/namebench_2017-10-27_1204.html.
(There is a german article on Heise.de concering namebench.)
dnseval
Dnseval is one out of three tools from the DNSDiag suite by Babak Farrokhi. At GitHub there are some install instructions. I already published a few information about dnseval here: Compare & Troubleshoot DNS Servers: dnseval. However, I merely looked at troubleshooting issues with DNS flags, TTL, and caching issues. Today I want to use dnseval to benchmark the DNS resolvers which is almost the same though. ;) I am simply using much more queries (such as -c 2000) while I started the measurement after I initially queried the name from all servers in order to have it in their caches. Be aware that dnseval only tests cache hits since it queries the same name again and again.
A sample run to test the resolver found at /etc/resolv.conf is:
|
1 |
./dnseval.py -c 2000 weberblog.net |
Test Examples & Results
For the following examples I queried and compared the following five DNS resolvers:
- My LAN router, AVM Fritzbox 7430 with FRITZ!OS 06.83 (DNS forward to my ISP Deutsche Telekom) at 2003:50:aa0c:3e00:ca0e:14ff:fe7e:339f
- A Raspberry Pi 1 B with Unbound version 1.4.17 (recursive DNS resolver that generates iterative queries throughout the DNS tree) at 2003:50:aa0c:3e00:ba27:ebff:fec9:1637
- OpenDNS at 2620:0:ccc::2
- Google Public DNS at 2001:4860:4860::8888
- Quad9 at 2620:fe::fe
For every run I queried 2000 entries.
namebench alexa
At first I used the alexa input source:
|
1 |
namebench --no_gui --input=alexa --query_count=2000 --only 2003:50:aa0c:3e00:ca0e:14ff:fe7e:339f 2003:50:aa0c:3e00:ba27:ebff:fec9:1637 2620:0:ccc::2 2001:4860:4860::8888 2620:fe::fe |
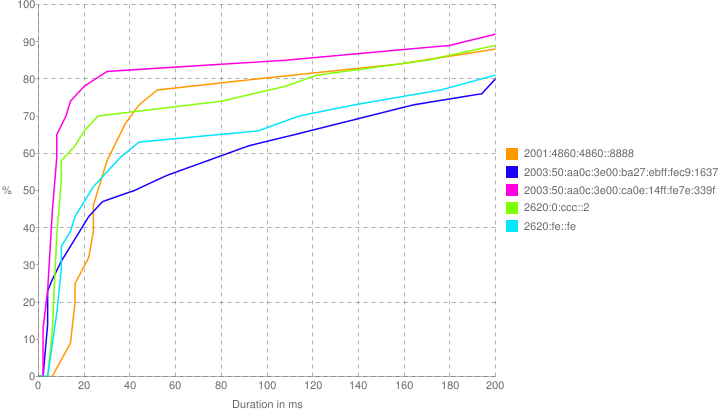
The winner was OpenDNS with a mean response of 75 ms (green) followed by the local Fritzbox with 87 ms (purple). Unbound (151 ms, blue) and Google Public DNS (178 ms, orange) are the last ones. I expected that Google would be faster. Hm. On the graph you can see that Unbound (the only iterative working DNS resolver in the test case) has a slow-growing curve since it really must query each name independently since I don’t have many cache hits in my local network compared to all public resolvers.
namebench cache-hit
Now the built-in “cachehit” test:
|
1 |
namebench --no_gui --input=cachehit --query_count=2000 --only 2003:50:aa0c:3e00:ca0e:14ff:fe7e:339f 2003:50:aa0c:3e00:ba27:ebff:fec9:1637 2620:0:ccc::2 2001:4860:4860::8888 2620:fe::fe |
 Huge differences between my two local DNS resolvers: the Fritzbox router (first line, average time of 1.8 ms!) was much faster than Unbound (last line, 9.5 ms). I was kind of shocked. I did not expect that the Raspberry Pi with Unbound was that much slower than a simple router! BUT:
namebench cache-hit UPDATED!
I changed the “cache-hit.txt” file (as already explained above) to query “weberblog.net.” rather than “a.root-servers.net.”. Here are the results:
Ah, here we go. Now the Fritzbox (first line, 2.17 ms) is only a little bit faster than Unbound (second line, 2.43 ms). As already noted I suppose that this test case now was a real cache-hit while the built-in version from namebench did query some local root.hints files. In any case, the three public DNS resolvers are almost comparable while (of course) slower due to the network patch.
namebench cache-miss
The last run of namebench, this time with some randomly queried names:
|
1 |
namebench --no_gui --input=cachemiss --query_count=2000 --only 2003:50:aa0c:3e00:ca0e:14ff:fe7e:339f 2003:50:aa0c:3e00:ba27:ebff:fec9:1637 2620:0:ccc::2 2001:4860:4860::8888 2620:fe::fe |
The winner again was the local Fritzbox router (purple, 14.63 ms) followed by OpenDNS (green, 15.52 ms), Unbound (blue, 16.79), and Quad9 (turquoise, 19.99 ms). Google Public DNS again was the slowest one (orange, 28.20 ms). As you can see in the graph, almost all curves are the same since all DNS server must query the random value one by one. The orange line from Google is shifted to the right, probably due to a slower routing path.
dnseval (cache-hit)
This is the cache hit test from dnseval. The two local DNS resolvers on my network are quite faster than the remote ones. The Unbound resolver on my Raspberry Pi had an average of 2.4 ms while my Fritzbox router had 1.8 ms:
|
1 2 3 4 5 6 7 8 |
weberjoh@nb17-testsrv:~/dnsdiag$ ./dnseval.py -f dns-servers -c 2000 weberblog.net server avg(ms) min(ms) max(ms) stddev(ms) lost(%) ttl flags ---------------------------------------------------------------------------------------------------------------------------------- 2003:50:aa0c:3e00:ca0e:14ff:fe7e:339f 1.874 1.418 2.790 0.128 %0 35539 QR -- -- RD RA -- -- 2003:50:aa0c:3e00:ba27:ebff:fec9:1637 2.427 2.114 4.562 0.137 %0 85662 QR -- -- RD RA -- -- 2620:0:ccc::2 6.245 3.701 9.610 0.542 %0 18070 QR -- -- RD RA -- -- 2001:4860:4860::8888 6.490 3.135 16.192 1.485 %0 17440 QR -- -- RD RA -- -- 2620:fe::fe 7.472 4.039 31.880 1.657 %0 85625 QR -- -- RD RA -- -- |
Compared to the updated cache-hit test from namebench the order of the DNS resolvers is almost the same: Fritzbox won, followed by Unbound which are both faster than the three public resolvers. Looking at them, OpenDNS was the fastest, but this time followed by Google Public DNS while Quad9 was the slowest.
Conclusion
It’s not easy to interpret the measured values in the correct way. You must precisely know what you are testing. As already pointed out you can test cache-hits, cache-misses or “real world” queries such as Alexa Top 1M which will have many cache-hits on public resolvers while just a few on your own resolvers.
In any case you are NOT benchmarking the load of a DNS resolver such as “how many DNS queries can it handle in parallel” or “how many clients can be handled by a Raspberry Pi” but the latency for single DNS queries. That is: you’re testing the IP routing network latency + the mere DNS server latency together.
[UPDATE] Traceroutes & Chaos Queries
As Bill requested in the comment section, here are the traceroutes and chaos query results from the three public DNS servers. First the traceroutes. I used mtr to display the routing paths as well:
|
1 2 3 4 5 6 7 8 9 10 11 12 13 14 15 16 17 18 19 20 21 22 23 24 25 26 27 28 29 30 31 32 33 34 35 36 37 38 39 40 41 42 43 44 45 46 47 48 49 50 51 52 53 54 55 56 57 58 59 |
weberjoh@nb17-testsrv:~$ mtr 2620:0:ccc::2 My traceroute [v0.86] nb17-testsrv (::) Tue Apr 24 09:39:01 2018 Keys: Help Display mode Restart statistics Order of fields quit Packets Pings Host Loss% Snt Last Avg Best Wrst StDev 1. fritz.box 0.0% 21 2.2 2.3 0.6 2.7 0.2 2003:0:1301:4205::1 2. 2003:0:1301:4205::1 0.0% 20 2.4 2.4 2.2 2.8 0.0 3. 2003:0:1308:338::2 0.0% 20 5.9 5.1 3.1 20.7 3.7 4. 2003:0:1307:400a::1 0.0% 20 3.0 3.0 2.7 3.3 0.0 5. 2003:0:1307:400a::2 0.0% 20 3.2 3.1 2.7 3.6 0.0 6. ae-24.r24.frnkge08.de.bb.gin.ntt.net 0.0% 20 2.7 3.9 2.6 24.1 4.8 7. ae-5.r06.frnkge02.de.bb.gin.ntt.net 0.0% 20 3.1 3.1 3.0 3.5 0.0 8. 2001:728:0:5000::19e 0.0% 20 3.3 3.4 3.1 4.5 0.2 9. resolver1.ipv6-sandbox.opendns.com 0.0% 20 3.0 3.0 2.8 3.3 0.0 weberjoh@nb17-testsrv:~$ weberjoh@nb17-testsrv:~$ weberjoh@nb17-testsrv:~$ mtr 2001:4860:4860::8888 My traceroute [v0.86] nb17-testsrv (::) Tue Apr 24 09:40:28 2018 Keys: Help Display mode Restart statistics Order of fields quit Packets Pings Host Loss% Snt Last Avg Best Wrst StDev 1. fritz.box 0.0% 41 2.8 2.7 1.0 4.5 0.3 2003:0:1301:4205::1 2. 2003:0:1301:4205::1 0.0% 41 2.3 2.5 2.2 4.1 0.3 3. 2003:0:1301:4238::2 0.0% 40 3.2 5.0 3.2 7.2 0.9 4. ??? 5. 2003:0:1304:800f::2 0.0% 40 2.9 2.9 2.7 3.1 0.0 6. 2a00:1450:8000:13a::1:1 0.0% 40 2.8 2.9 2.8 3.1 0.0 7. 2001:4860:0:1::1b36 0.0% 40 3.0 5.8 2.9 43.5 7.0 2001:4860:0:1::1b38 8. 2001:4860:0:1::7e9 0.0% 40 2.9 3.0 2.7 4.1 0.2 2001:4860:0:1::c8b 2001:4860:0:1::a39 9. google-public-dns-a.google.com 0.0% 40 2.4 2.5 2.4 2.9 0.0 weberjoh@nb17-testsrv:~$ weberjoh@nb17-testsrv:~$ weberjoh@nb17-testsrv:~$ mtr 2620:fe::fe My traceroute [v0.86] nb17-testsrv (::) Tue Apr 24 09:42:43 2018 Keys: Help Display mode Restart statistics Order of fields quit Packets Pings Host Loss% Snt Last Avg Best Wrst StDev 1. fritz.box 0.0% 20 2.5 2.3 1.2 2.7 0.0 2003:0:1301:4205::1 2. 2003:0:1301:4205::1 0.0% 20 2.3 2.8 2.2 9.8 1.6 3. 2003:0:1308:338::2 0.0% 20 6.2 5.5 3.2 8.1 1.2 4. 2003:0:1307:400a::1 0.0% 20 3.2 3.0 2.7 3.4 0.0 5. 2003:0:1307:400a::2 0.0% 20 3.0 3.0 2.8 3.3 0.0 6. ae-0.a01.frnkge03.de.bb.gin.ntt.net 5.0% 20 3.2 8.5 2.5 26.2 7.2 7. xe-0-0-29-1.a01.frnkge03.de.ce.gin.ntt. 5.3% 20 3.5 5.4 3.4 14.0 3.4 8. dns.quad9.net 0.0% 20 2.6 2.8 2.5 3.3 0.0 |
Note that only Quad9 responded to the chaos query:
|
1 2 3 4 5 6 7 |
weberjoh@nb17-testsrv:~$ dig @2620:0:ccc::2 version.bind txt chaos +short weberjoh@nb17-testsrv:~$ weberjoh@nb17-testsrv:~$ dig @2001:4860:4860::8888 version.bind txt chaos +short weberjoh@nb17-testsrv:~$ weberjoh@nb17-testsrv:~$ dig @2620:fe::fe version.bind txt chaos +short "Q9-U-5.0" weberjoh@nb17-testsrv:~$ |
Featured image “Koblenz – Hochwassermarken am Kranhaus” by onnola is licensed under CC BY-SA 2.0.


Can you post traceroutes and chaos query results for each of the anycast nameservers, so we can see where the performance difference was coming from?
Hey Bill. Thanks for your question. I added the results for the traceroutes and chaos queries in the blogpost above.
namebench has also a mode where it uses your browsers cache DNS queries, which is possibly rather *your* “real world” than the Alexa list