Category Archives: Monitoring

Monitoring the local network, firewall statistics, temperature values, energy consumption, or whatever.

Internet’s Noise

If you are following the daily IT news you have probably seen many articles claiming they have scanned the whole Internet for this or that. Indeed there are tools such as the ZMap Project “that enable researchers to perform large-scale studies of the hosts and services that compose the public Internet”.

This time I was not interested in scanning something, but in the question about “how many scans happen during one day on my home ISP connection?” Or in other words: What is the Internet background noise as seen by almost any customer? For this I sacrificed my Internet connection at home for 24 hours, while a factory-resetted router established a fresh Internet connection (IPv6 & IPv4) without any end devices behind it. No outgoing connections that could confuse or trigger any scans. That is: All incoming connections are really unsolicited and part of some third-party port scans, worm activities, or whatever. Using a network TAP device I captured these 24 hours and analyzed them with Wireshark.

In this blogpost I will present some stats about these incoming port scans. Furthermore I am publishing the pcap file so you can have a look at it by yourself.

Continue reading Internet’s Noise

Signed DNS Zone with too long-living TTLs

Implementing DNSSEC for a couple of years now while playing with many different DNS options such as TTL values, I came around an error message from DNSViz pointing to possible problems when the TTL of a signed resource record is longer than the lifetime of the DNSSEC signature itself. Since I was not fully aware of this (and because I did not run into a real error over the last years) I wanted to test it more precisely.

Continue reading Signed DNS Zone with too long-living TTLs

Dump1090 ADS-B Stats

Genau das Richtige für mich: Viele Statistiken bzgl. des ADS-B Empfangs. Konkret laufen diese dump1090-tools lokal auf dem Raspberry Pi und werten das Log von dump1090-mutability aus. (Siehe meinem letzten Post zur Installation von dump1090.) Vorallem die Statistiken über die Anzahl der empfangenen Flugzeuge sowie den Empfangsbereich sind einfach zu verstehen und sehr interessant.

Die Installation dieser Tools ist ebenfalls sehr einfach – nur wenige Befehle. (Auch wenn ein alter Raspberry Pi 1 B dann über 30 Minuten zum Ausführen braucht.) Ziemlich out-of-the-box werden dann im 5 Minuten Takt neue RRDtool Grafiken erzeugt. Los geht’s:

Continue reading Dump1090 ADS-B Stats

Lastline SNMP Monitoring

This is just a small post on how to enable SNMP on a Lastline Advanced Malware Protection appliance in order to query the basic host and network MIBs from an SNMP monitoring server. Note that this is not the preferred method of monitoring a Lastline device. The Product API (PAPI) should be used instead such as shown in the online docs. However, basic SNMP gives access to the CPU, memory, load average and the network interface statistics incl. the anonymous VPN tunnel interface.

Since all Lastline devices are basically a Ubuntu server, the basic setup for SNMP is quite similar to my tutorial for a generic Linux. The only step missing there is the allow statement for the Uncomplicated Firewall (ufw).

Continue reading Lastline SNMP Monitoring

CPU Usage Increase FortiGate 100D -> 90D

A few weeks ago I swapped a FortiGate 100D firewall to a 90D firewall. The 100D was defective and needed to be replaced. Since the customer only has a 20 Mbps ISP connection, I thought that a FortiGate 90D would fit for the moment, since it has a firewall throughput of 3,5 Gbps, compared to the lower value of 2,5 Gbps from the 100D.

Indeed, it worked. However, the CPU usage increase was huge, almost related to the NGFW throughput. Here are some graphs:

Continue reading CPU Usage Increase FortiGate 100D -> 90D

Using NetFlow with nProbe for ntopng

This blog post is about using NetFlow for sending network traffic statistics to an nProbe collector which forwards the flows to the network analyzer ntopng. It refers to my blog post about installing ntopng on a Linux machine. I am sending the NetFlow packets from a Palo Alto Networks firewall.

My current ntopng installation uses a dedicated monitoring ethernet port (mirror port) in order to “see” everything that happens in that net. This has the major disadvantage that it only gets packets from directly connected layer 2 networks and vlans. NetFlow on the other hand can be used to send traffic statistics from different locations to a NetFlow flow collector, in this case to the tool nProbe. This single flow collector can receive flows from different subnets and routers/firewalls and even VPN tunnel interfaces, etc. However, it turned out that the “real-time” functionalities of NetFlow are limited since it only refreshes flows every few seconds/bytes, but does not give a real-time look at the network. It should be used only for statistics but not for real-time troubleshooting.

Continue reading Using NetFlow with nProbe for ntopng

ntopng Installation

Some time ago I published a post introducing ntopng as an out-of-the-box network monitoring tool. I am running it on a Knoppix live Linux notebook with two network cards. However, I have a few customers that wanted a persistent installation of ntopng in their  environment. So this is a step-by-step tutorial on how to install ntopng on a Ubuntu server with at least two NICs.

Continue reading ntopng Installation

MRTG/Routers2: Template FortiGate

A few weeks ago I constructed an MRTG/Routers2 template for the Fortinet FortiGate firewalls. I am using it for monitoring the FortiGate from my MRTG/Routers2 server. With the basic MRTG tool “cfgmaker” all graphs for the interfaces are generated automatically. My template is an add-on that appends graphs for CPU, memory, and disk usage, as well as connections and VPN statistics. Furthermore, it implements the ping statistics graph and a “short summary”, which only shows the system relevant graphs.

Continue reading MRTG/Routers2: Template FortiGate

Out of the Box Network Analyzer “ntopng”

Some time ago I installed a new firewall at the customer’s site. Meanwhile the customer was interested in the flows that are traversing through the firewall right now. Oh. Good question. Of course it is easy to filter through log messages of firewalls, but theses logs are only for finished sessions. Yes, there are “session browsers” or the like on all firewalls, but they are not nice and handy to analyze the sessions in real-time.

The solution was to bring a network analyzer on a mirror port near to the firewall. I decided to use ntopng running on the live Linux distribution Knoppix. Great choice! An old notebook with two network adapters fits perfectly. A handful commands and you’re done:

Continue reading Out of the Box Network Analyzer “ntopng”

MRTG/Routers2: Template Juniper SSG

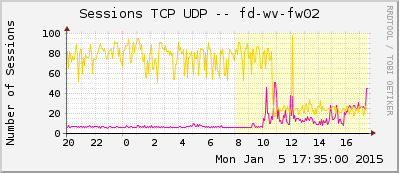
Finally, this is how I am monitoring my Juniper ScreenOS SSG firewalls with MRTG/Routers2. Beside the interfaces (that can be built with cfgmaker) I am using my template in order to monitor the CPU & memory, count of sessions & VPNs, count of different kind of attacks, etc.

Continue reading MRTG/Routers2: Template Juniper SSG

MRTG/Routers2: Template Juniper SA/MAG

I am monitoring an (old) SA-2000 cluster of Juniper Secure Access devices with my MRTG/Routers2 system. With the JUNIPER-IVE-MIB I built the configuration file for that monitoring system. In this blog post, I show the graphs generated with MRTG/Routers2 and publish my cfg file as a template.

Continue reading MRTG/Routers2: Template Juniper SA/MAG

MRTG/Routers2: Template Cisco ASA

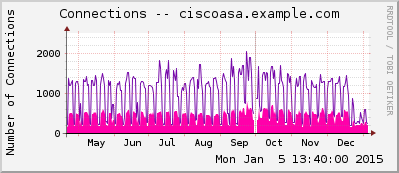
I constructed a MRTG/Routers2 configuration template for the Cisco ASA firewall which consists the OIDs (graphs) for the interfaces, CPU, memory, VPNs, connections, ping times, and traceroute hop counts. With only four search-and-replace changes as well as a few further specifications, the whole SNMP monitoring for that firewall is configured.

Continue reading MRTG/Routers2: Template Cisco ASA