
The other day I just wanted to capture some basic Linux traceroutes but ended up troubleshooting different traceroute commands and Wireshark display anomalies. Sigh. Anyway, I just added a few Linux traceroute captures – legacy and IPv6 – to the Ultimate PCAP. Here are some details:
Yep, I was shocked myself, but while I had some Windows traceroutes (based on ICMP echo-requests) and even some layer 4 traceroutes (sending TCP SYNs, e.g.) in the Ultimate PCAP, I was missing a generic Linux traceroute that uses UDP datagrams to destination ports ≥ 33434 for it. So, here we are.

Traceroute with Legacy IP
I used an Ubuntu 16.04.7 LTS (GNU/Linux 4.4.0-234-generic x86_64):
|
1 2 3 4 5 6 7 8 9 10 11 12 13 14 15 16 17 18 19 |
weberjoh@nb15-lx:~$ traceroute -V Modern traceroute for Linux, version 2.0.21 Copyright (c) 2008 Dmitry Butskoy, License: GPL v2 or any later weberjoh@nb15-lx:~$ weberjoh@nb15-lx:~$ weberjoh@nb15-lx:~$ traceroute netsec.blog traceroute to netsec.blog (5.35.226.136), 30 hops max, 60 byte packets 1 192.168.3.1 (192.168.3.1) 14.003 ms 13.960 ms 13.932 ms 2 ip-037-024-166-081.um08.pools.vodafone-ip.de (37.24.166.81) 15.423 ms 16.794 ms 15.892 ms 3 ip-178-200-118-001.um45.pools.vodafone-ip.de (178.200.118.1) 29.912 ms 33.328 ms 33.087 ms 4 ip-081-210-129-132.um21.pools.vodafone-ip.de (81.210.129.132) 32.901 ms 33.709 ms 33.813 ms 5 de-fra04d-rc1-ae-7-0.aorta.net (84.116.197.245) 41.520 ms 41.025 ms 40.964 ms 6 de-fra04c-ri1-ae15-101.aorta.net (84.116.191.6) 37.400 ms 18.572 ms 18.346 ms 7 et-7-0-0-u100.fra1-cr-polaris.bb.gdinf.net (80.81.192.239) 20.243 ms 20.314 ms 20.112 ms 8 ae0.fra10-cr-antares.bb.gdinf.net (87.230.115.1) 20.941 ms 20.509 ms 24.838 ms 9 ae2.cgn1-cr-nashira.bb.gdinf.net (87.230.114.4) 25.985 ms 26.216 ms 26.038 ms 10 ae0.100.sr-jake.cgn1.dcnet-emea.godaddy.com (87.230.114.222) 38.922 ms 38.912 ms 24.242 ms 11 * * * 12 wp367.webpack.hosteurope.de (5.35.226.136) 23.472 ms 23.407 ms 19.353 ms |
Pro-tip for Wireshark: Use a custom column which shows the hop limit (IPv6) and TTL (IPv4) in one column:

By default, traceroute sends three packets with the same hop limit/TTL starting by 1. This results in various UDP streams. At the time of writing with Wireshark version 4.0.1, the coloring of those packets is this: the first 12 UDP streams are marked red (TTL 1-4), while the other ones aren’t. (We are currently discussing the default coloring rules here at the Wireshark issues pages.) Right after it, the ICMP “time-to-live exceeded” error messages came in, while traceroute itself sent out various reverse DNS queries (omitted in the following screenshot):
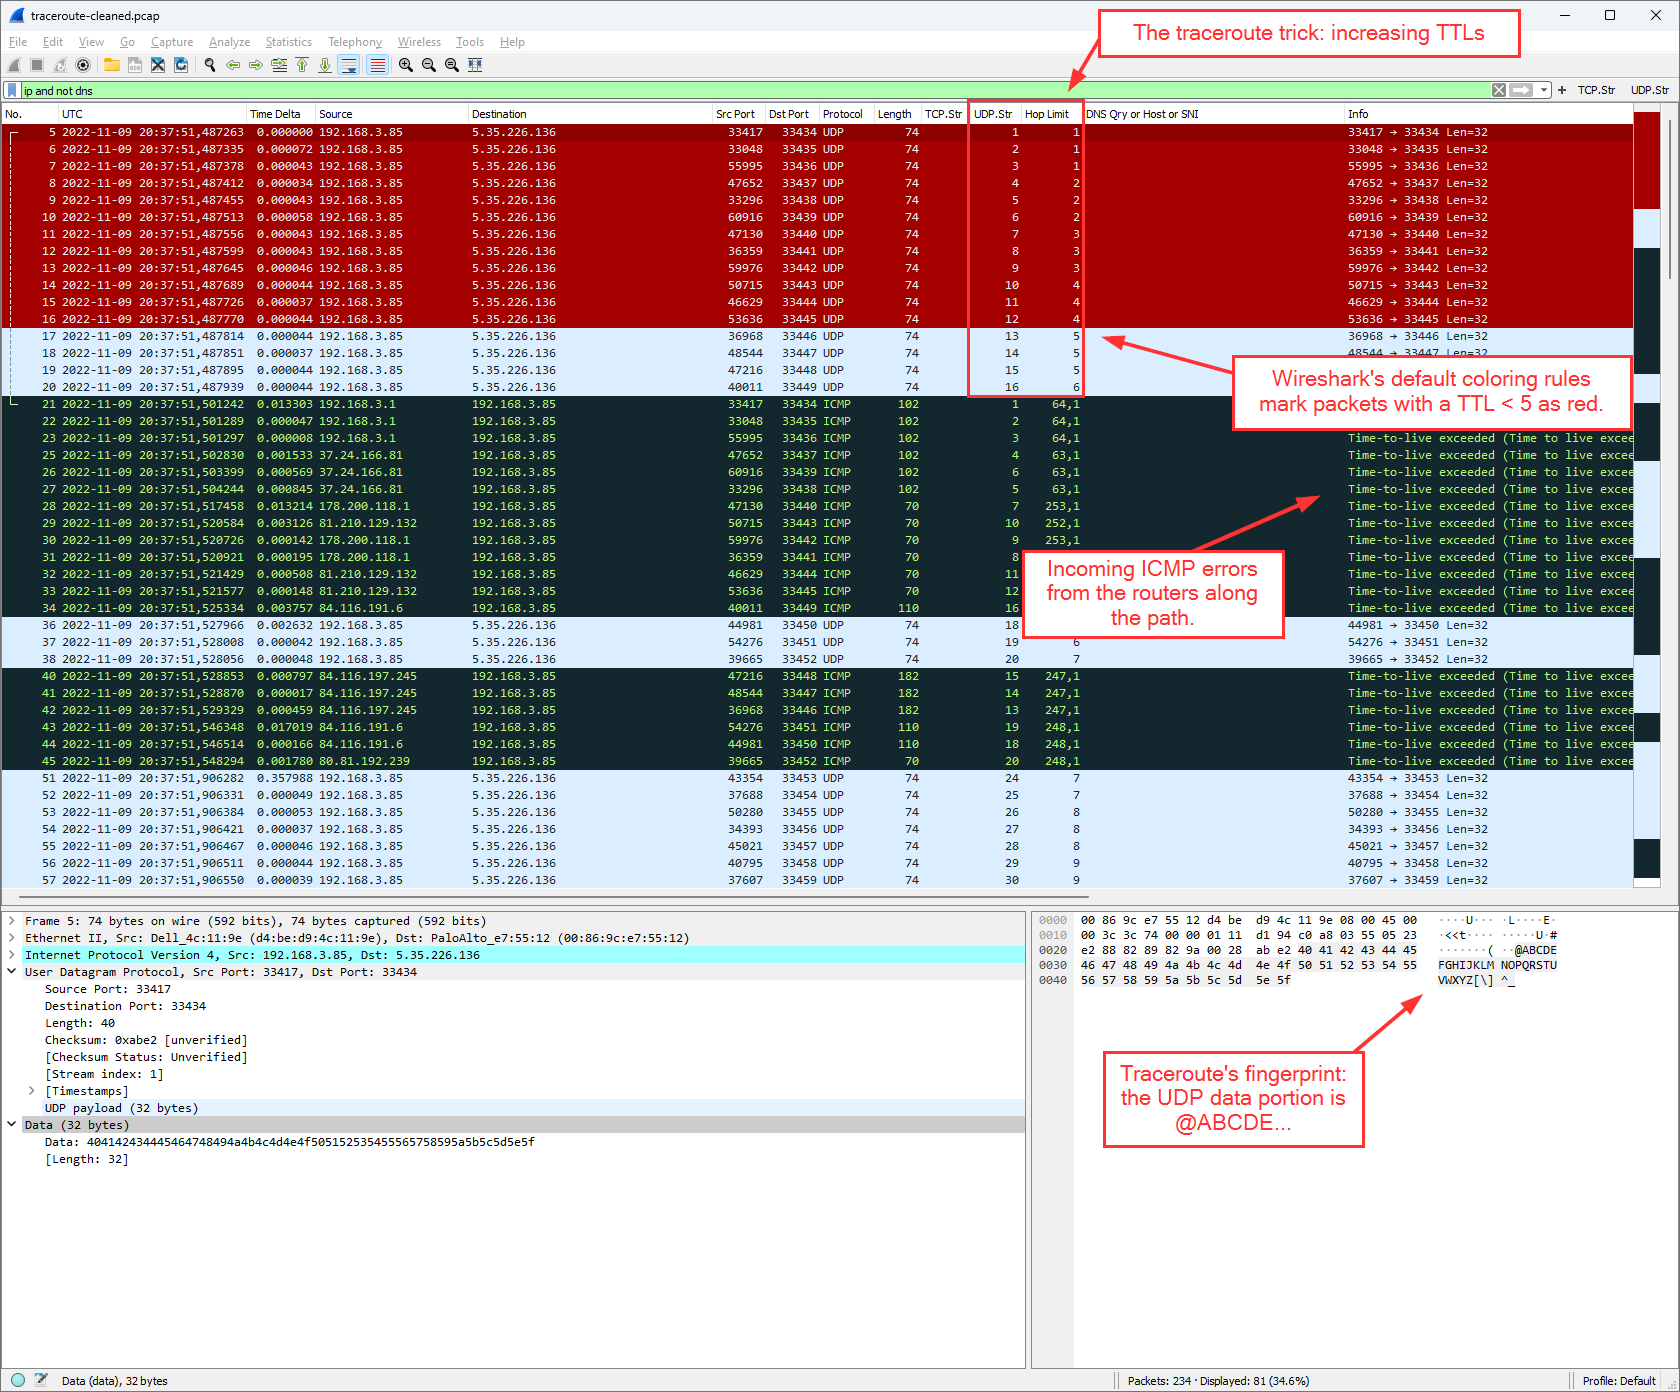
This was the moment when I discovered a small bug within Wireshark (from my point of view), namely that the connecting line for ICMP errors is not working in both directions.
traceroute6 ≠ traceroute -6
Then it turned a little strange. I was always confused about which CLI command I should use for ping and/or traceroute for IPv6: traceroute6 or traceroute -6. The man page from traceroute states:
While the man page from traceroute6 states:

This is a traceroute6 call:
|
1 2 3 4 5 6 7 8 9 10 11 12 13 14 15 16 17 18 19 20 21 22 23 24 25 26 27 28 29 30 31 32 33 34 35 36 |
weberjoh@nb15-lx:~$ traceroute6 -V traceroute6 utility, iputils-s20121221 weberjoh@nb15-lx:~$ weberjoh@nb15-lx:~$ weberjoh@nb15-lx:~$ traceroute6 netsec.blog traceroute to netsec.blog (2a01:488:42:1000:50ed:8588:8a:c570) from 2001:470:7250::b15:22, 30 hops max, 24 byte packets 1 pa-dmz.weberlab.de (2001:470:7250::1) 1.058 ms 0.287 ms 0.181 ms 2 router1-fa0-1.weberlab.de (2001:470:1f0b:319::1) 0.835 ms 1.234 ms 1.036 ms 3 tunnel643592.tunnel.tserv6.fra1.ipv6.he.net (2001:470:1f0a:319::1) 14.686 ms 16.142 ms 13.943 ms 4 * * * 5 et-7-0-0-u100.fra1-cr-polaris.bb.gdinf.net (2001:7f8::5125:f1:1) 12.482 ms 10.207 ms 11.824 ms 6 ae0.fra10-cr-antares.bb.gdinf.net (2a01:488:bb03:100::3) 19.943 ms 12.124 ms 11.887 ms 7 ae2.cgn1-cr-nashira.bb.gdinf.net (2a01:488:bb02:101::2) 11.712 ms 29.159 ms 17.87 ms 8 ae0.sr-jake.cgn1.dcn.heg.com (2a01:488:bb::223) 28.083 ms 16.166 ms 16.063 ms 9 * * * 10 * * * 11 * * * 12 * * * 13 * * * 14 * * * 15 * * * 16 * * * 17 * * * 18 * * * 19 * * * 20 * * * 21 * * * 22 * * * 23 * * * 24 * * * 25 * * * 26 * * * 27 * * * 28 * * * 29 * * * 30 * * * |
(Don’t worry about the count to 30 hops for this. The destination or a firewall somewhere there is not responding, hence it counts to infinity which is 30 for traceroute.)
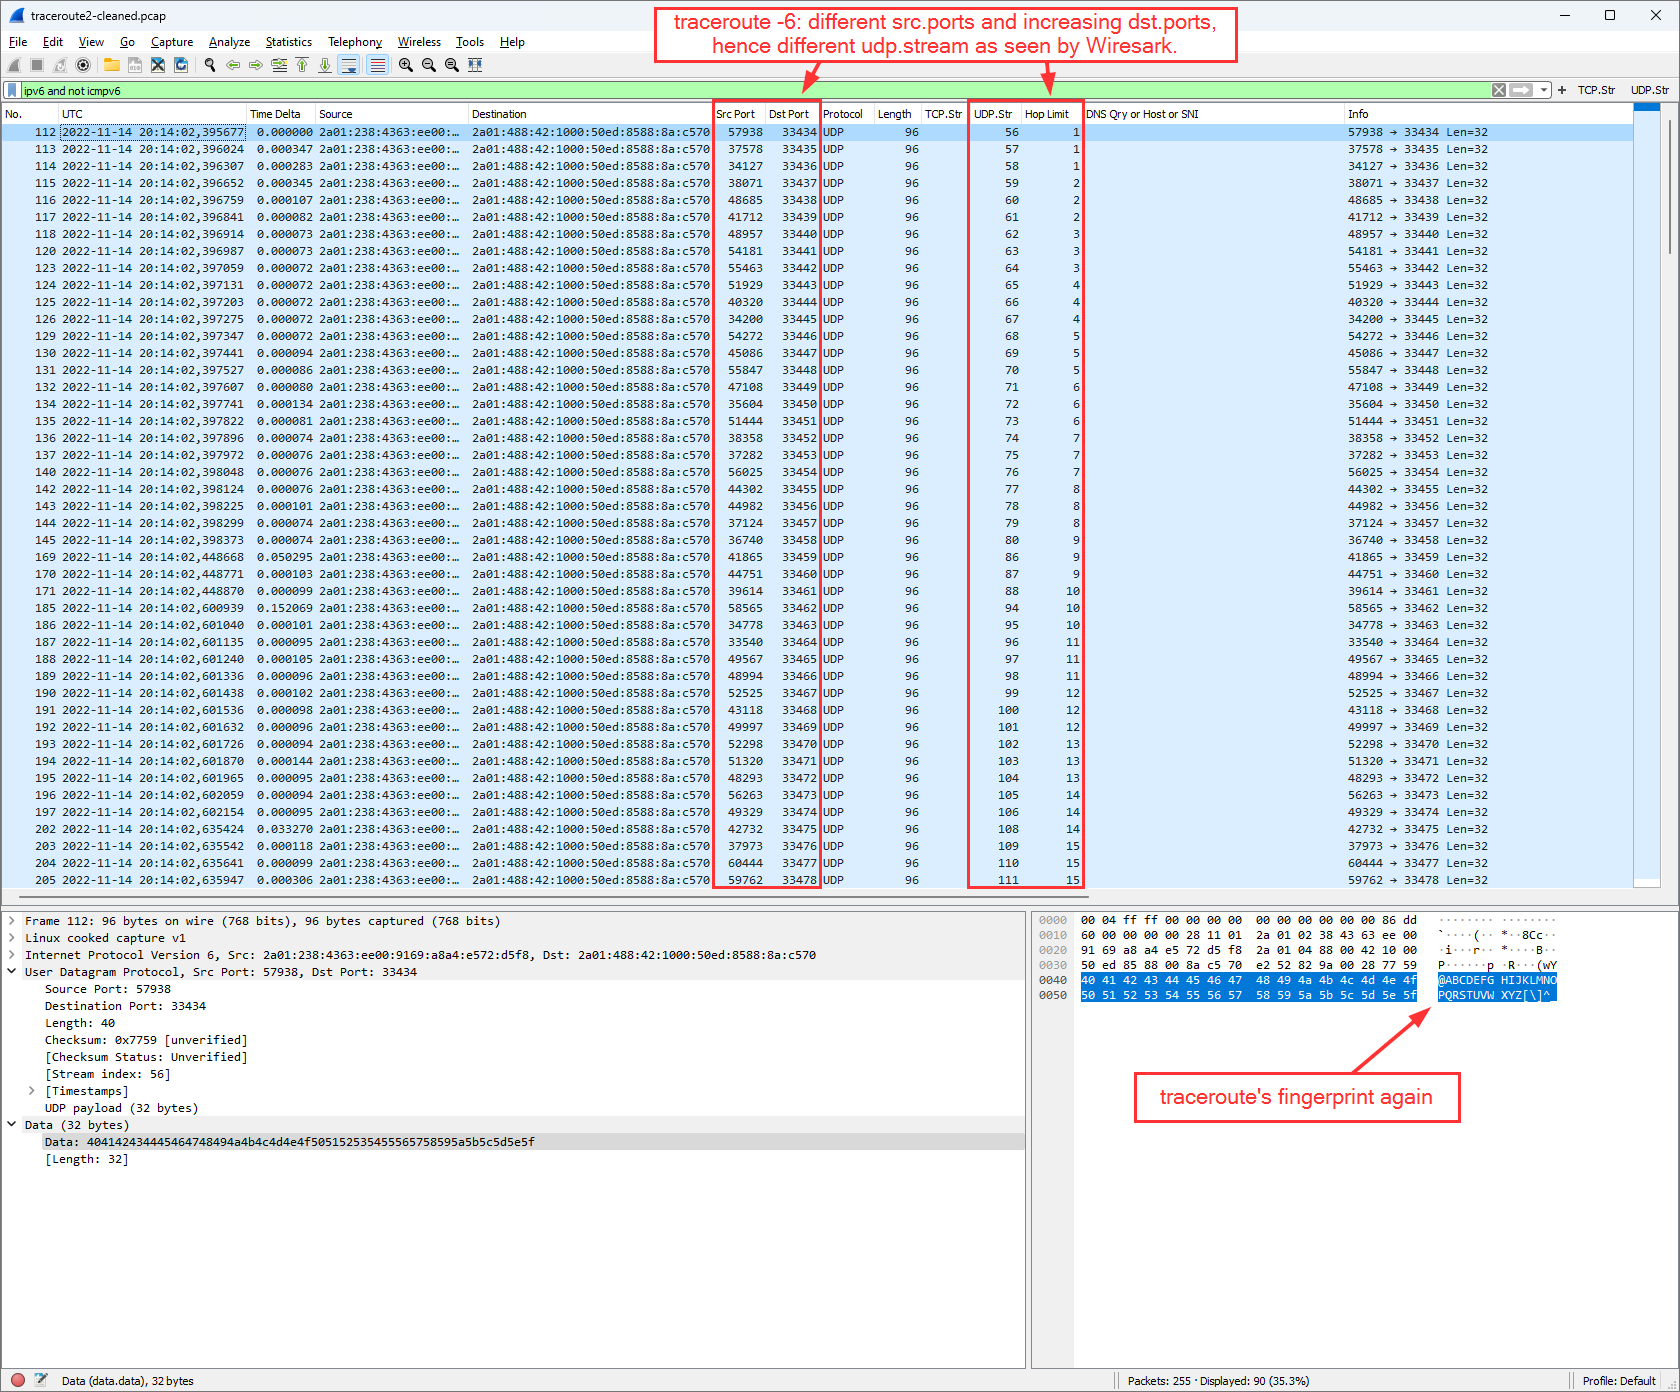
But within Wireshark, it looked like this (omitting the ICMPv6 messages here). That is: Only one static UDP destination port, hence only one UDP stream as seen by Wireshark. Furthermore, a different data portion:

(Don’t worry that no packets at all are marked red (compared to the legacy IP ones), this is part of this discussion as well. It might change with Wireshark versions > 4.0.)
That’s why I did a traceroute -6, this time from another machine: Ubuntu 20.04.5 LTS (GNU/Linux 5.4.0 x86_64):
|
1 2 3 4 5 6 7 8 9 10 11 12 13 14 15 16 17 18 19 20 21 22 23 24 25 26 27 28 29 30 31 32 33 34 35 36 37 |
weberjoh@h2877111:~$ traceroute -V Modern traceroute for Linux, version 2.1.0 Copyright (c) 2016 Dmitry Butskoy, License: GPL v2 or any later weberjoh@h2877111:~$ weberjoh@h2877111:~$ weberjoh@h2877111:~$ traceroute -6 netsec.blog traceroute to netsec.blog (2a01:488:42:1000:50ed:8588:8a:c570), 30 hops max, 80 byte packets 1 * * * 2 491.ae12.core-b1.as6724.net (2a01:238:b:105::1) 0.285 ms 0.271 ms 0.210 ms 3 110.ae14.bb-rt1-2.h20.r22.rs.ber.de.as6724.net (2a01:238:b:3901::1) 0.400 ms 0.343 ms 110.ae13.bb-rt1-1.e18.r23.rs.ber.de.as6724.net (2a01:238:b:3801::1) 0.537 ms 4 ae-0-88.bb-a.ak.ber.de.oneandone.net (2001:8d8:0:3::99) 0.852 ms 0.817 ms ae-1-88.bb-a.ak.ber.de.oneandone.net (2001:8d8:0:3::a1) 0.799 ms 5 ae-13.bb-a.tp.kae.de.net.ionos.com (2001:8d8:0:2::1d2) 14.510 ms 14.451 ms 14.365 ms 6 ae-2.bb-b.bs.kae.de.net.ionos.com (2001:8d8:0:5::4) 16.837 ms 16.863 ms 16.871 ms 7 ae-9.bb-b.fr7.fra.de.net.ionos.com (2001:8d8:0:2::11e) 16.884 ms 16.905 ms 16.964 ms 8 et-7-0-0-u100.fra1-cr-polaris.bb.gdinf.net (2001:7f8::5125:f1:1) 16.417 ms 16.441 ms 16.403 ms 9 ae0.fra10-cr-antares.bb.gdinf.net (2a01:488:bb03:100::3) 17.188 ms 17.259 ms 17.183 ms 10 ae2.cgn1-cr-nashira.bb.gdinf.net (2a01:488:bb02:101::2) 19.992 ms 19.405 ms 19.340 ms 11 ae0.sr-jake.cgn1.dcn.heg.com (2a01:488:bb::223) 59.756 ms 59.678 ms 59.631 ms 12 * * * 13 * * * 14 * * * 15 * * * 16 * * * 17 * * * 18 * * * 19 * * * 20 * * * 21 * * * 22 * * * 23 * * * 24 * * * 25 * * * 26 * * * 27 * * * 28 * * * 29 * * * 30 * * * |
Which now looks more familiar compared to the traceroute for legacy IP:
By the way: This is what the traffic log from a Palo Alto Networks NGFW looks like for those two tools:
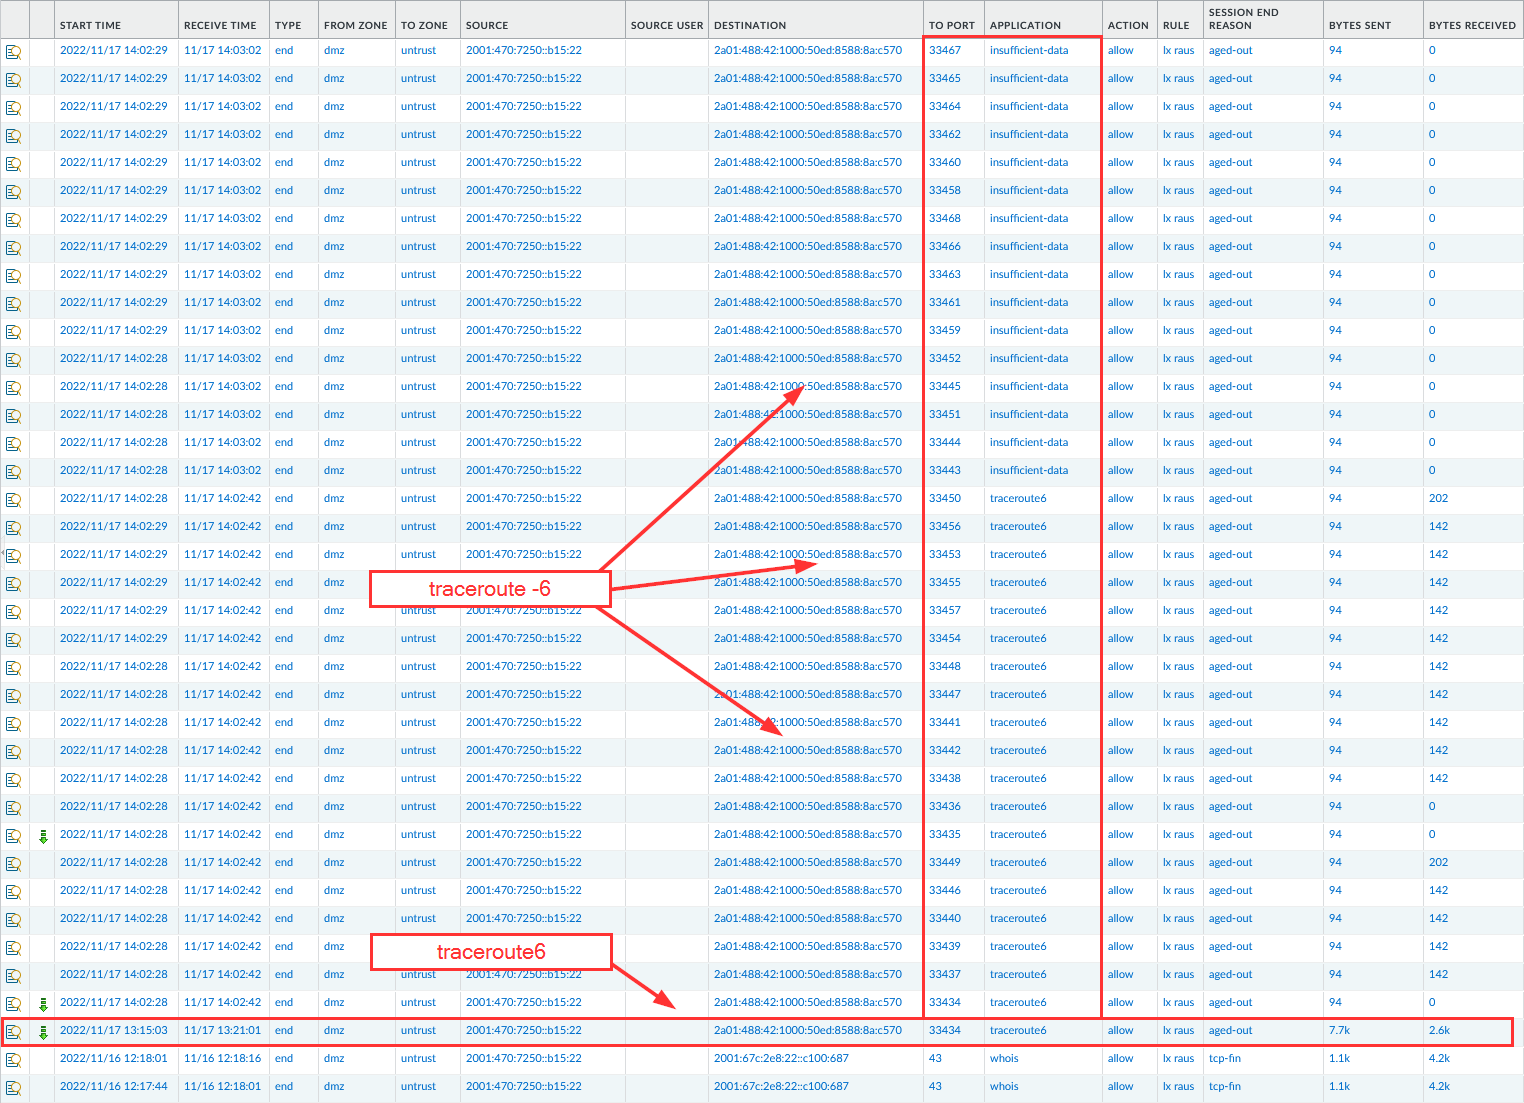
Anyway, those traceroutes are now within the Ultimate PCAP along with the ICMPv6/ICMP errors coming back and the DNS queries made by those traceroute tools. Thus you can investigate them by yourself. Note that those Linux traceroutes are not a protocol by themselves, hence there is no direct display filter. You can use something like this:
|
1 |
udp.dstport in { 33434 .. 33534 } and ( ip.ttl < 31 || ipv6.hlim < 31 ) |
Want to join the discussion?
Some tweets about those investigations during the last weeks:
In #DualStack environments, traceroute will use legacy IP primarily. AHHH. Why?!? #IPv6 pic.twitter.com/shLuS1n1aZ
— Johannes Weber ? (@webernetz) October 21, 2022
Ouch! The man page states "traceroute6 is equivalent to traceroute -6" and it's NOT! While "traceroute6" sends all datagrams to the same dst.port (same stream), "traceroute -6" sends each datagram to an increased dst.port (different streams). Different tools! #IPv6 #details pic.twitter.com/2k3qD6KpQj
— Johannes Weber ? (@webernetz) November 14, 2022
Yeah, that happens to me when I “just want to have a short look at something”. ?
Photo by Nick Seagrave on Unsplash.
One thought on “Linux’s Traceroute”