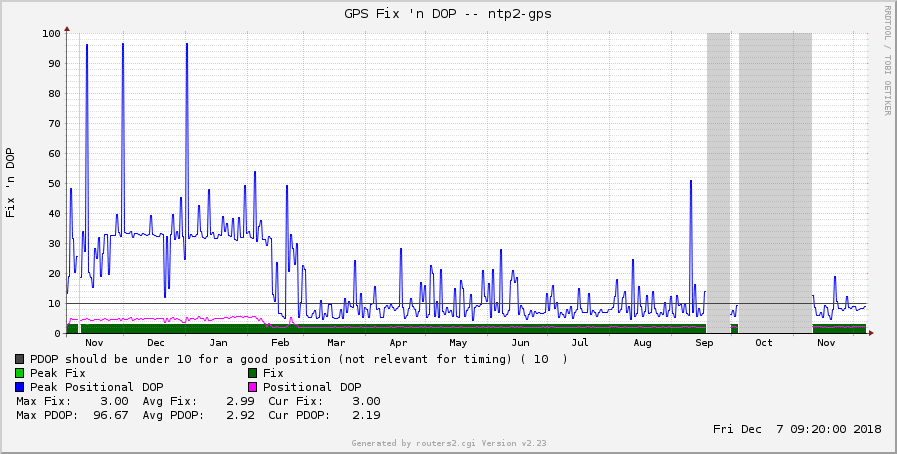
Beyond monitoring Linux OS and basic NTP statistics of your stratum 1 GPS NTP server, you can get some more values from the GPS receiver itself, namely the number of satellites (active & in view) as well as the GPS fix and dilution of precision aka DOP. This brings a few more graphs and details. Nice. Let’s go:
NMEA 0183
The GPS-based NTP server consists of two inputs: The NMEA sentences to get the date and time (along with much other information as the position, which is the primary usage of GPS) and the PPS pulse per second ticks. In order to get some live stats about the satellites and the precision of the GPS signal, we leverage some of the NMEA sentences. Since the gpsd daemon is already running on the Raspberry Pi, we can easily use another tool called “gas pipe” which simply lists all incoming NMEA data. Sample usage of gpspipe -r:
|
1 2 3 4 5 6 7 8 9 10 11 12 13 14 15 16 17 18 19 20 21 22 23 24 25 26 27 28 29 30 31 |
pi@ntp2-gps:~ $ gpspipe -r {"class":"VERSION","release":"3.16","rev":"3.16-4","proto_major":3,"proto_minor":11} {"class":"DEVICES","devices":[{"class":"DEVICE","path":"/dev/ttyAMA0","driver":"u-blox","subtype":"Unknown","activated":"2019-03-21T13:34:24.189Z","flags":1,"native":1,"bps":9600,"parity":"N","stopbits":1,"cycle":1.00,"mincycle":0.25}]} {"class":"WATCH","enable":true,"json":false,"nmea":true,"raw":0,"scaled":false,"timing":false,"split24":false,"pps":false} $GPZDA,133425.00,21,03,2019,00,00*6E $GPGGA,133425,5132.2081,N,01356.7869,E,2,08,1.00,197.16,M,47.711,M,,*4F $GPRMC,133425,A,5132.2081,N,01356.7869,E,0.0471,136.251,210319,,*2E $GPGSA,A,3,2,6,12,19,24,25,32,123,,,,,,,,,,,,,,,,,,,,,,,,,,,,,,,,,,,,,,,,,,,2.0,1.0,1.7*08 $GPGBS,133425,1.95,M,2.98,M,9.89,M*3A $GPZDA,133426.00,21,03,2019,00,00*6D $GPGGA,133426,5132.2082,N,01356.7868,E,2,08,1.00,196.74,M,47.711,M,,*4B $GPRMC,133426,A,5132.2082,N,01356.7868,E,0.0557,219.635,210319,,*22 $GPGSA,A,3,2,6,12,19,24,25,32,123,,,,,,,,,,,,,,,,,,,,,,,,,,,,,,,,,,,,,,,,,,,2.0,1.0,1.7*08 $GPGSV,4,1,13,02,23,113,40,06,24,077,38,12,83,015,38,14,27,311,18*7C $GPGSV,4,2,13,17,04,037,21,19,24,044,19,24,50,138,46,25,53,266,32*77 $GPGSV,4,3,13,29,21,198,17,32,36,295,13,123,28,151,41,127,18,126,30*7B $GPGSV,4,4,13,128,01,102,31*70 $GPZDA,133427.00,21,03,2019,00,00*6C $GPGGA,133427,5132.2084,N,01356.7867,E,2,08,1.00,196.66,M,47.711,M,,*40 $GPRMC,133427,A,5132.2084,N,01356.7867,E,0.1544,279.026,210319,,*2B $GPGSA,A,3,2,6,12,19,24,25,29,32,123,,,,,,,,,,,,,,,,,,,,,,,,,,,,,,,,,,,,,,,,,,2.0,1.0,1.7*03 $GPGBS,133429,1.95,M,2.98,M,9.89,M*36 $GPZDA,133430.00,21,03,2019,00,00*6A $GPGGA,133430,5132.2086,N,01356.7865,E,2,08,1.00,195.86,M,47.711,M,,*4B $GPRMC,133430,A,5132.2086,N,01356.7865,E,0.0151,297.432,210319,,*2D $GPGSA,A,3,2,6,12,19,24,25,29,32,123,,,,,,,,,,,,,,,,,,,,,,,,,,,,,,,,,,,,,,,,,,2.0,1.0,1.7*03 $GPZDA,133431.00,21,03,2019,00,00*6B $GPGGA,133431,5132.2088,N,01356.7864,E,2,08,1.00,195.57,M,47.711,M,,*49 $GPRMC,133431,A,5132.2088,N,01356.7864,E,0.2654,279.194,210319,,*2A $GPGSA,A,3,2,6,12,19,24,25,29,32,123,,,,,,,,,,,,,,,,,,,,,,,,,,,,,,,,,,,,,,,,,,2.0,1.0,1.7*03 $GPGBS,133431,1.95,M,2.98,M,9.89,M*3F |
Piping this output into grep XY -m 1 to stop after the first output, and piping it again into awk -F ',' '{print $X}' to have the comma as separator as well as printing only the X-th position, we can use the following NMEA messages to gather this information:
- satellites in view: GPGSV at the fourth position
- satellites being active: GPGGA after the seventh comma = position 8
- GPS fix (0 = no fix, 1 = 2D fix, 3= 3D fix which is the best): GPGSA at position 3
- positional dilution of precision aka PDOP (should be under 10 for a good position, but irrelevant for our NTP timing): GPGSA again, normally at position 15, but for whatever reason on my output it is at position 54.
A sample run with these four values is:
|
1 2 3 4 5 6 7 8 |
pi@ntp2-gps:~ $ gpspipe -r | grep GPGSV -m 1 | awk -F ',' '{print $4}' 13 pi@ntp2-gps:~ $ gpspipe -r | grep GPGGA -m 1 | awk -F ',' '{print $8}' 08 pi@ntp2-gps:~ $ gpspipe -r | grep GPGSA -m 1 | awk -F ',' '{print $3}' 3 pi@ntp2-gps:~ $ gpspipe -r | grep GPGSA -m 1 | awk -F ',' '{print $54}' 2.4 |
That’s it from the NTP server’s side of view. Now we have to bring those values into the monitoring server:
SNMP into MRTG
I am still using my fairly outdated MRTG with Routers2 and RRD installation. Please consider using some other tools such as Zabbix, Icinga 2, or PRTG for monitoring purposes. However, the following procedures in getting the raw values from the NTP server into some kind of SNMP monitoring system are the same.
I am using the “EXTENDING THE AGENT” section within the snmpd.conf in order to be able to poll these values through SNMP. That is: sudo nano /etc/snmp/snmpd.conf adding the following lines at the EXTENDING THE AGENT section:
|
1 2 3 4 |
extend-sh gpsfix gpspipe -r | grep GPGSA -m 1 | awk -F ',' '{print $3}' extend-sh gpspdop gpspipe -r | grep GPGSA -m 1 | awk -F ',' '{print $54}' extend-sh gpssatact gpspipe -r | grep GPGGA -m 1 | awk -F ',' '{print $8}' extend-sh gpssatview gpspipe -r | grep GPGSV -m 1 | awk -F ',' '{print $4}' |
Followed by a sudo service snmpd restart.
Using snmpwalk on the MRTG server to find the relevant OIDs, such as:
|
1 2 3 4 5 6 7 |
weberjoh@jw-vm01-mrtg:~$ snmpwalk -v 2c -c THISISTHEKEY udp6:ntp2.weberlab.de .1.3.6.1.4.1.8072.1.3.2.3.1.1 iso.3.6.1.4.1.8072.1.3.2.3.1.1.5.116.101.115.116.49 = STRING: "Hello, world!" iso.3.6.1.4.1.8072.1.3.2.3.1.1.5.116.101.115.116.50 = STRING: "Hello, world!" iso.3.6.1.4.1.8072.1.3.2.3.1.1.6.103.112.115.102.105.120 = STRING: "2" iso.3.6.1.4.1.8072.1.3.2.3.1.1.7.103.112.115.112.100.111.112 = STRING: "2.7" iso.3.6.1.4.1.8072.1.3.2.3.1.1.9.103.112.115.115.97.116.97.99.116 = STRING: "04" iso.3.6.1.4.1.8072.1.3.2.3.1.1.10.103.112.115.115.97.116.118.105.101.119 = STRING: "13" |
In the end my two MRTG targets for all four values (that is: 2x graphs) are as follows:
|
1 2 3 4 5 6 7 8 9 10 11 12 13 14 15 16 17 18 19 20 21 22 23 24 25 26 27 28 29 30 31 32 33 34 |
Target[ntp2-gps-satellites]: 1.3.6.1.4.1.8072.1.3.2.3.1.1.9.103.112.115.115.97.116.97.99.116&1.3.6.1.4.1.8072.1.3.2.3.1.1.10.103.112.115.115.97.116.118.105.101.119:THISISTHEKEY@ntp2.weberlab.de::11:5::2 MaxBytes[ntp2-gps-satellites]: 24 Title[ntp2-gps-satellites]: GPS Satellites -- ntp2-gps Colours[ntp2-gps-satellites]: DARKGREEN#006600, PINK#FF00FF, GREEN#00CC00, BLUE#0000FF Options[ntp2-gps-satellites]: gauge integer YLegend[ntp2-gps-satellites]: Satellites Legend1[ntp2-gps-satellites]: Satellites active Legend2[ntp2-gps-satellites]: Satellites in view Legend3[ntp2-gps-satellites]: Peak satellites active Legend4[ntp2-gps-satellites]: Peak satellites in view LegendI[ntp2-gps-satellites]: Satellites active: LegendO[ntp2-gps-satellites]: Satellites in view: ShortLegend[ntp2-gps-satellites]: routers.cgi*Options[ntp2-gps-satellites]: fixunit nomax nototal routers.cgi*ShortDesc[ntp2-gps-satellites]: GPS Satellites ntp2-gps routers.cgi*Icon[ntp2-gps-satellites]: globe-sm.gif Target[ntp2-gps-fixdop]: 1.3.6.1.4.1.8072.1.3.2.3.1.1.6.103.112.115.102.105.120&1.3.6.1.4.1.8072.1.3.2.3.1.1.7.103.112.115.112.100.111.112:JESUSISTHEKEY@ntp2.weberlab.de::11:5::2 MaxBytes[ntp2-gps-fixdop]: 100 Title[ntp2-gps-fixdop]: GPS Fix 'n DOP -- ntp2-gps Colours[ntp2-gps-fixdop]: DARKGREEN#006600, PINK#FF00FF, GREEN#00CC00, BLUE#0000FF Options[ntp2-gps-fixdop]: gauge YLegend[ntp2-gps-fixdop]: Fix 'n DOP Legend1[ntp2-gps-fixdop]: Fix Legend2[ntp2-gps-fixdop]: Positional DOP Legend3[ntp2-gps-fixdop]: Peak Fix Legend4[ntp2-gps-fixdop]: Peak Positional DOP LegendI[ntp2-gps-fixdop]: Fix: LegendO[ntp2-gps-fixdop]: PDOP: ShortLegend[ntp2-gps-fixdop]: routers.cgi*Options[ntp2-gps-fixdop]: fixunit nomax nototal routers.cgi*ShortDesc[ntp2-gps-fixdop]: GPS Fix 'n DOP ntp2-gps routers.cgi*HRule[ntp2-gps-fixdop]: 10 "PDOP should be under 10 for a good position (not relevant for timing)" routers.cgi*Icon[ntp2-gps-fixdop]: globe-sm.gif |
This gives the following graphs. Note the daily period for the satellites, depending on the position of the GPS antenna. Satellites graph (in the weekly view):
And the GPS fix and PDOP graph (in the weekly view as well):
Two more graphs, both in the yearly view, that show my change from a small GPS antenna to a bigger one at the beginning of February 2018. While the average number of active satellites increased from about 5 to almost 8, the daily peak for the PDOP decreased from about 33 to under 10. Very good!
That’s it. Have a nice day. :D
Featured image “Cockpit” by Roger Schultz is licensed under CC BY 2.0.


