Monitoring a Meinberg LANTIME appliance is much easier than monitoring DIY NTP servers. Why? Because you can use the provided enterprise MIB and load it into your SNMP-based monitoring system. Great. The MIB serves many OIDs such as the firmware version, reference clock state, offset, client requests, and even more specific ones such as “correlation” and “field strength” in case of my phase-modulated DCF77 receiver (which is called “PZF” by Meinberg). And since the LANTIME is built upon Linux, you can use the well-known system and interfaces MIBs as well for basic coverage. Let’s dig into it:
I am working with a Meinberg LANTIME M200 with firmware-build 6.24.021. Unfortunately, I am still using my outdated MRTG with Routers2 and RRDtool installation which is not able to load MIBs. ;D Hence I have constructed a couple of MRTG targets by myself. It was still much easier than using bash snippets with grep ‘n sed or advanced logging features in order to count clients.
Before starting with the monitoring server you must ensure that you’ve enabled SNMP on the appropriate interface and that you’re using SNMPv3 with strong authentication and encryption. (However, I am still using plaintext SNMPv2c. Shame on me.) After that, you can have a look at the SNMP values, for example with the iReasoning MIB Browser that is capable of loading the MIB.
Linux Defaults
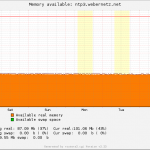
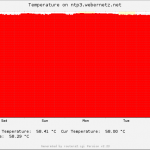
At first I followed my basic procedure for adding a Linux host to MRTG. I changed the icon to the clock one: routers.cgi*Icon: clock-sm.gif. There is no SWAP available on the LANTIME, hence the following MRTG line throws an error: “MaxBytes2[ntp3.weberlab.de-memory]: 0”. I simply added the same value as for MaxBytes1, though it is not correct. But never mind: MaxBytes2[ntp3.weberlab.de-memory]: 235347968. Finally I added the temperature (OID: .1.3.6.1.4.1.5597.30.0.5.2.1.0) such as I am using other temperature graphs, e.g., for the Raspberry Pi. This is the temperature MRTG target:
|
1 2 3 4 5 6 7 8 9 10 11 12 13 14 15 16 17 18 |
############################################################### ####################### Temperature ########################### ############################################################### Target[ntp3.weberlab.de_temp]: 1.3.6.1.4.1.5597.30.0.5.2.1.0&PseudoZero:COMMUNITYSTRING@ntp3.weberlab.de:::::2 MaxBytes[ntp3.weberlab.de_temp]: 150 Title[ntp3.weberlab.de_temp]: Temperature on ntp3.weberlab.de Options[ntp3.weberlab.de_temp]: gauge WithPeak[ntp3.weberlab.de_temp]: my Colours[ntp3.weberlab.de_temp]: Red#FF0000, Blue#0000FF, Darkred#800000, Purple#FF00FF YLegend[ntp3.weberlab.de_temp]: Temperature °C Legend1[ntp3.weberlab.de_temp]: Temperature Legend3[ntp3.weberlab.de_temp]: Peak Temperature LegendI[ntp3.weberlab.de_temp]: Temperature: ShortLegend[ntp3.weberlab.de_temp]: °C routers.cgi*Options[ntp3.weberlab.de_temp]: fixunit nomax nopercentile nototal noo routers.cgi*ShortDesc[ntp3.weberlab.de_temp]: Temperature routers.cgi*InSummary[ntp3.weberlab.de_temp]: yes routers.cgi*Icon[ntp3.weberlab.de_temp]: temp-sm.gif |
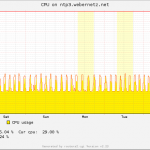
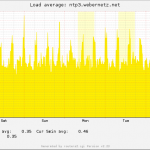
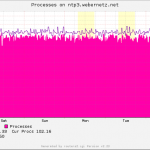
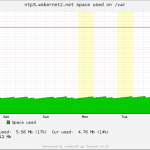
Up to now I have the following graphs: CPU, load average, free memory, processes, couple of disks, interface, temperature:
Offset
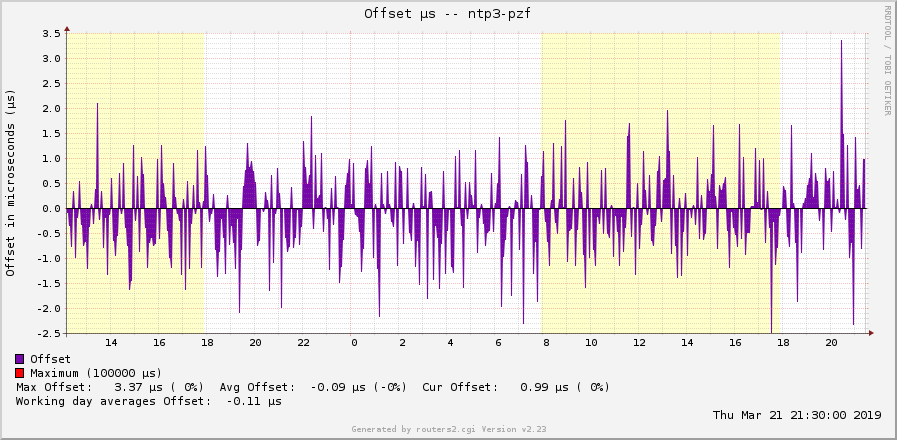
Of course, the most interesting value of a stratum 1 NTP server is the offset – the difference between the local built-in clock and the reference clock, in my case the german DCF77 signal. OID from Meinberg: .1.3.6.1.4.1.5597.30.0.2.4.0. Note that in the following MRTG target I am multiplying the value with 1000 to have it displayed in µs rather than in ms:
|
1 2 3 4 5 6 7 8 9 10 11 12 13 14 15 16 17 |
############################################################### ################### Offset µ Microseconds ##################### ############################################################### Target[ntp3-pzf-offset-us]: 1.3.6.1.4.1.5597.30.0.2.4.0&PseudoZero:COMMUNITYSTRING@ntp3.weberlab.de:::::2 * 1000 #Max only 0.1 seconds = 100 ms = 100000 us MaxBytes[ntp3-pzf-offset-us]: 100000 Title[ntp3-pzf-offset-us]: Offset µs -- ntp3-pzf Options[ntp3-pzf-offset-us]: gauge Colours[ntp3-pzf-offset-us]: DARKPURPLE#7608AA, Blue#0000FF, BLACK#000000, Purple#FF00FF YLegend[ntp3-pzf-offset-us]: Offset in microseconds (µs) Legend1[ntp3-pzf-offset-us]: Offset Legend3[ntp3-pzf-offset-us]: Peak Offset LegendI[ntp3-pzf-offset-us]: Offset: ShortLegend[ntp3-pzf-offset-us]: µs routers.cgi*Options[ntp3-pzf-offset-us]: fixunit nototal noo routers.cgi*ShortDesc[ntp3-pzf-offset-us]: Offset µs ntp3-pzf routers.cgi*Icon[ntp3-pzf-offset-us]: graph-sm.gif |
And again, MRTG specific: You must tweak the RRD file in order to store negative values as well:
|
1 2 3 4 5 6 7 |
rrdtool info /var/mrtg/ntp3-pzf-offset-us.rrd sudo rrdtool tune /var/mrtg/ntp3-pzf-offset-us.rrd --minimum ds0:-100000 rrdtool info /var/mrtg/ntp3-pzf-offset-us.rrd ### ds[ds0].min = -1.0000000000e+05 ds[ds0].max = 1.0000000000e+05 ### |
It ends up in this nice graph:
You might have noticed that I am not graphing the jitter from the LANTIME appliance. This is because the jitter values are not accessible via SNMP. ;( Feature request is pending.
PZF Correlation & Field Strength
There are two more specific status OIDs for the reference clock, in my case a “PZF” antenna, i.e., phase-modulated DCF77. Those two values are:
- correlation with a max of 100
- field strength with a max of 127
To be honest, I have no idea what these values are about. :D Never mind, I am graphing them:
|
1 2 3 4 5 6 7 8 9 10 11 12 13 14 15 16 17 18 19 20 |
############################################################### ############# PZF Correlation & Field Strength ################ ############################################################### Target[ntp3-pzf-correlation]: 1.3.6.1.4.1.5597.30.0.1.2.1.6.1&1.3.6.1.4.1.5597.30.0.1.2.1.8.1:COMMUNITYSTRING@ntp3.weberlab.de:::::2 MaxBytes1[ntp3-pzf-correlation]: 100 MaxBytes2[ntp3-pzf-correlation]: 127 Title[ntp3-pzf-correlation]: PZF Correlation & Field Strength -- ntp3-pzf Colours[ntp3-pzf-correlation]: DARKGREEN#006600, PINK#FF00FF, GREEN#00CC00, BLUE#0000FF Options[ntp3-pzf-correlation]: gauge integer YLegend[ntp3-pzf-correlation]: Correlation & Field Strength Legend1[ntp3-pzf-correlation]: Correlation Legend2[ntp3-pzf-correlation]: Field Strength Legend3[ntp3-pzf-correlation]: Peak Correlation Legend4[ntp3-pzf-correlation]: Peak Field Strength LegendI[ntp3-pzf-correlation]: Correlation: LegendO[ntp3-pzf-correlation]: Strength: ShortLegend[ntp3-pzf-correlation]: routers.cgi*Options[ntp3-pzf-correlation]: fixunit nototal routers.cgi*ShortDesc[ntp3-pzf-correlation]: Correlation & Strength ntp3-pzf routers.cgi*Icon[ntp3-pzf-correlation]: globe-sm.gif |
The resulting monthly view looks like this:
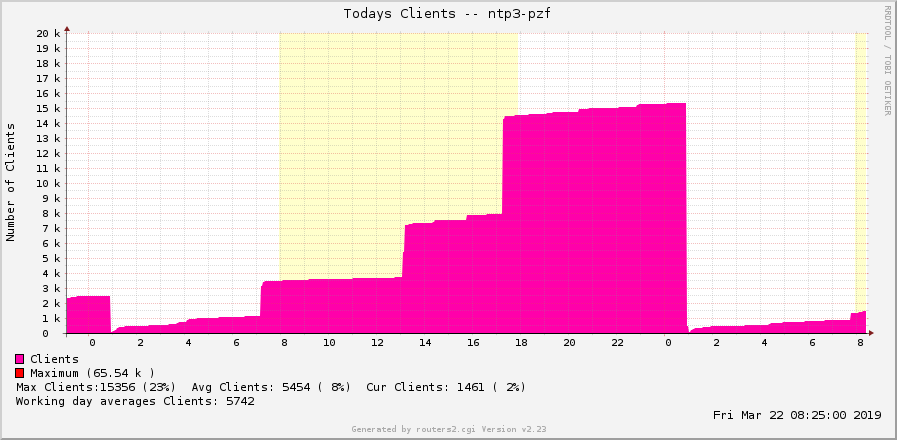
Today’s Clients & Requests
Having activated the client list logging at Statistics -> NTP Client List -> Activate Logging with the “Duration of Recording” set to “Continously” you can query the number of today’s clients as well as the total requests.
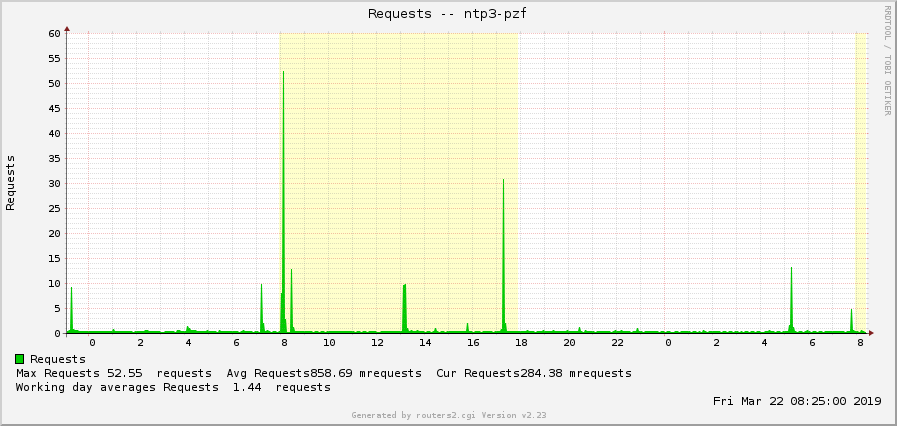
Note that at least for the latter it’s kind of hard to graph it with MRTG. You can either list them as a gauge which grows always or you can display them like packets per second, that is, requests per second. However, this gives strange values since MRTG calculates them always “per second”. If you have only a couple of NTP clients you will have something like micro-requests per second which doesn’t give a good number.
Anyway, this is my approach with MRTG:
|
1 2 3 4 5 6 7 8 9 10 11 12 13 14 15 16 17 18 19 20 21 22 23 24 25 26 27 28 29 30 31 32 |
############################################################### ########################## Clients ############################ ############################################################### Target[ntp3-pzf-clientstoday]: 1.3.6.1.4.1.5597.30.0.2.8.8.0&PseudoZero:COMMUNITYSTRING@ntp3.weberlab.de:::::2 MaxBytes[ntp3-pzf-clientstoday]: 65536 Title[ntp3-pzf-clientstoday]: Todays Clients -- ntp3-pzf Colours[ntp3-pzf-clientstoday]: Pink#FF00AA, Yellow#FFD600, Darkpurple#7608AA, Orange#FC7C01 Options[ntp3-pzf-clientstoday]: gauge integer YLegend[ntp3-pzf-clientstoday]: Number of Clients Legend1[ntp3-pzf-clientstoday]: Clients Legend3[ntp3-pzf-clientstoday]: Peak Clients LegendI[ntp3-pzf-clientstoday]: Clients: ShortLegend[ntp3-pzf-clientstoday]: routers.cgi*Options[ntp3-pzf-clientstoday]: nototal noo routers.cgi*ShortDesc[ntp3-pzf-clientstoday]: Clients ntp3-pzf Today routers.cgi*Icon[ntp3-pzf-clientstoday]: user-sm.gif routers.cgi*InSummary[ntp3-pzf-clientstoday]: yes ############################################################### ######################### Requests ############################ ############################################################### Target[ntp3-pzf-requests]: 1.3.6.1.4.1.5597.30.0.2.8.4.0&PseudoZero:COMMUNITYSTRING@ntp3.weberlab.de:::::2 MaxBytes[ntp3-pzf-requests]: 10000 Title[ntp3-pzf-requests]: Requests -- ntp3-pzf YLegend[ntp3-pzf-requests]: Requests Legend1[ntp3-pzf-requests]: Requests Legend3[ntp3-pzf-requests]: Peak Requests LegendI[ntp3-pzf-requests]: Requests ShortLegend[ntp3-pzf-requests]: requests routers.cgi*Options[ntp3-pzf-requests]: nomax noo routers.cgi*ShortDesc[ntp3-pzf-requests]: Requests ntp3-pzf |
At least the “Today’s Clients” graph gives a realistic view about the clients. Note that my M200 is in the NTP Pool Project. Hence thousands of clients within a couple of seconds, every time my IPv6 address appears in their DNS. This counter is reset every night, hence the drop to 0 at midnight:
The requests somehow correlate to this clients view but are hard to interpret. Please note again that this is a limitation of my MRTG solution and not of the Meinberg counter.
In case anybody’s wondering: I had no performance degradation with the “NTP Client List Logging” on the Meinberg M200, though it is not recommended by the vendor to leave it in the “Continuously” state. I have not seen any issues in the load average / CPU graphs.
Example
Here’s an example in which I used the correlation & field strength graph (left-hand side) since I had a loss of the DCF77 signal during a couple of hours. The right-hand side shows the reach graph from my DIY DCF77 Raspberry Pi NTP server:
Today (2018-12-04) from 2:45 to 6:45am UTC+1 the #DCF77 signal was lost on both of my NTP servers (Meinberg & RaspberryPi, residing on different physical locations). Don't know why. Any ideas? @MeinbergSync @shad0whunter @CharlyKuehnast pic.twitter.com/zryslcG4qt
— Johannes Weber ? (@webernetz) December 4, 2018
It turned out that there was indeed an outage of the DCF77 signal during that period.
Okay, that’s it. Happy monitoring!
Featured image “Octocopter” by FaceMePLS is licensed under CC BY 2.0.



Thank you for this great post. Should you ever figure out what PZF Correlation and Field Strength mean, please let us know, because I have the exact same question. ;-)
The signal strength value depends on the amplitude of the received 77.5 kHz signal, in the same way as for standard receivers just that evaluate the amplitude modulated second marks of the DCF77.
Unfortunately, a high signal level can also originate from electric noise in the 77.5 kHz frequency range, so a high high signal level alone is no guarantee for a proper reception of the original signal. If the original signal is weak, and there is only a low noise level, reception can be better than in a case where the original signal is strong, but the noise level is very high.
Meinberg PZF receivers also decode the phase modulation of the 77.5 kHz carrier.
The modulating signal is a 512 bit digital pseudo-random noise (PRN) code, where a ‘0’ bit causes a carrier phase shift in one direction, and a ‘1’ bit causes a phase shift in the opposite direction.
Since a PRN code sequence has the same number of ‘0’ and ‘1’ bits, the mean carrier phase is not affected by the phase modulation.
The PRN code is modulated onto the carrier every second between the end of the last AM second mark and the beginning of the next AM second mark. See also:
https://www.ptb.de/cms/en/ptb/fachabteilungen/abt4/fb-44/ag-442/dissemination-of-legal-time/dcf77/dcf77-phase-modulation.html
A PZF receiver also generates the well-known PRN code locally, compares it to the PRN code derived from the carrier phase shift of the incoming DCF77 signal, and measures the time in which both signals match, i.e. have the same logic level, both ‘0’ or both ‘1’.
As long as the two PRN signals are shifted in time by more than 1 bit time, both signals have the same logic level only half of the maximum time, i.e. the match is 50 %, which means the 2 signals are not correlated to each other. This is due to the noise characteristics of PRN codes.
If the signal generated by the receiver is shifted in time so that the effective time shift between the 2 PRN signals becomes less than 1 bit time, the signals are correlated to each other, i.e. they match more than 50 % of the maximum time.
If the generated PRN signal is shifted such that it matches the received PRN signal as good as possible, the highest possible correlation has been achieved. This can be 100 % in theory, if both signals really match exactly.
However, due to the limited bandwidths of the antennae, electrical distortinons, etc., the shape of the received PRN signal may more or less deviate from the ideal waveform, so the best possible correlation can be less than 100 %.
Anyway, if the correlation value is 90 % or 95 % this is an indicator of good reception, while a correlation value of 60 % or 65 % indicates that reception is poor. A correlation value less than 50 % is not possible. This would just indicate a correlation with an inverted signal.
BTW, this technique is basically also used by GPS receivers, where each receiver channel is a correlator for an individual, well-known PRN code assigned to a specific satellite. The advantage of the PRN codes used by GPS is that they have a much longer PRN code sequence generated at a much higher clock rate than for DCF77.
For GPS and similar signals this is known as “spread spectrum” technology, which also greatly reduces the susceptibility to electrical noise.
Thank you! ??