
An updated version of my Ultimate PCAP is available. It features some more network protocols that I will depict in this blog post. It’s getting more special since the most common protocols were already in there. ;)
FTP and FTPS
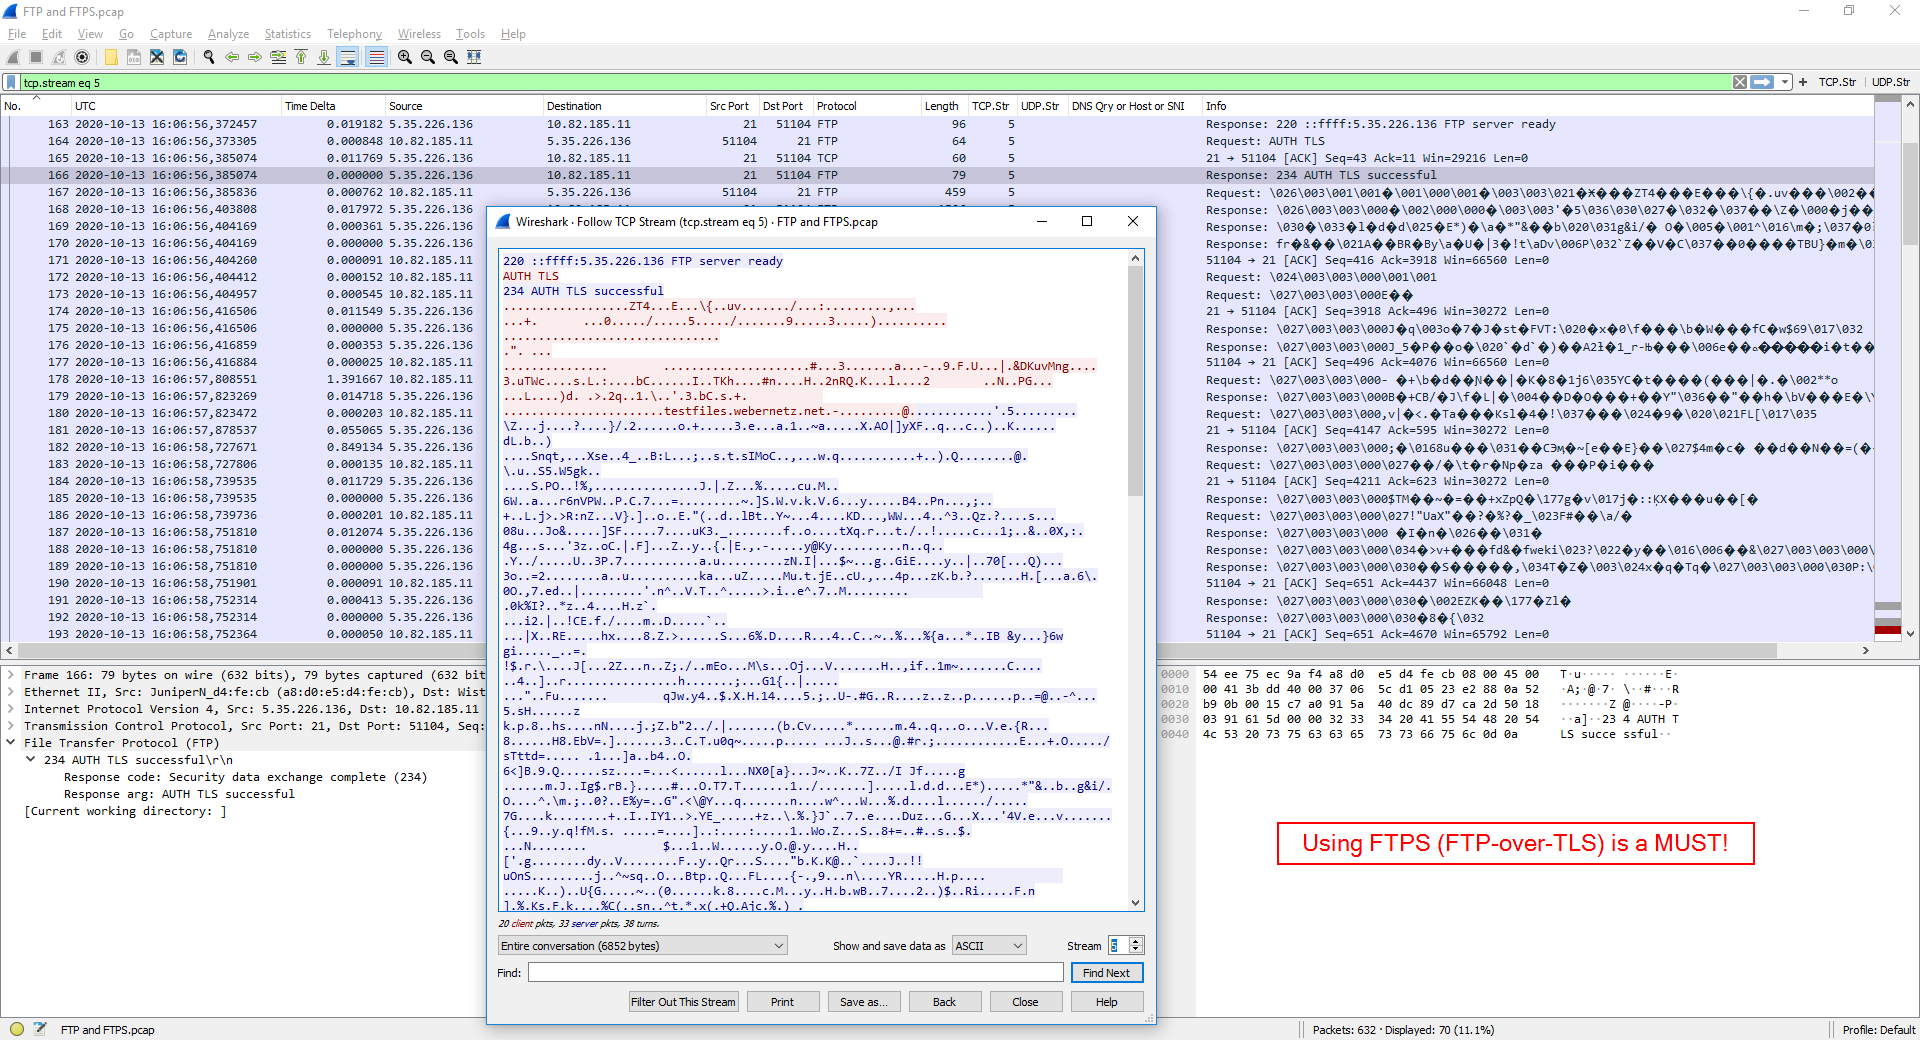
Definitely one of the most well-known protocols: FTP. There are three FTP sessions in the trace:
- Two IPv4 FTP sessions between ip.addr eq 10.82.185.11 and ip.addr eq 5.35.226.136 – one via unencrypted FTP (yes, you can see the password and the whole transferred file!), and one with TLS. I used the FileZilla version 3.50.0.
- One IPv6 session from a Windows 7 PC using the file explorer, which uses unencrypted FTP. Ouch. Display filter: ipv6.addr eq 2001:470:765b:0:1965:111f:4398:d558 and ipv6.addr eq 2a01:488:42:1000:50ed:8588:8a:c570 .
You have to use the IP based display filter rather than ftp or ftp-data in order to see the whole TCP handshake and TLS session. Even tcp.port in { 20 21 } is not enough due to the usage of dynamic passive ports! Sigh.
In all three sessions, I logged in, changed the directory to “/Correct Files” and downloaded the “Lorem ipsum dolor sit amet.txt” file. (Which can be found here: https://testfiles.webernetz.net/.)

BFD
The Bidirectional Forwarding Detection protocol (RFC 5881) is used between routers to detect link failures really fast. In my trace file, you can find two routers using OSPF in conjunction with BFD. It uses UDP ports 3784 for control packets and 3785 for its echo packets. Wireshark’s display filter “bfd” will only show the control packets while “bfd_echo” will show the echo packets. You can also other filters such as udp.port in { 3784 3785 } to filter for them. (This will also show an ICMP destination unreachable port unreachable after the very first control packet which is not shown by the “bfd” filter.)
In the following screenshot, you can also see an ICMP port unreachable right after the very first control packet. To my mind, this is because the BFD neighborship was not yet established or the router sending the first control message has not yet opened the receiving port.

The trace shows the first seconds after router reboot, captured with my ProfiShark.
Cisco IOS configuration used for this setup:
|
1 2 3 4 5 6 7 8 9 |
interface GigabitEthernet0/0 ip address 193.24.225.56 255.255.255.0 bfd interval 250 min_rx 250 multiplier 3 ! router ospf 2311 network 7.7.7.7 0.0.0.0 area 1 network 193.24.225.0 0.0.0.255 area 1 bfd all-interfaces ! |
Show command:
|
1 2 3 4 5 6 7 8 9 10 11 12 13 14 15 16 17 18 19 20 21 22 |
R4#show bfd neighbors details NeighAddr LD/RD RH/RS State Int 193.24.225.54 1/8 Up Up Gi0/0 Session state is UP and using echo function with 250 ms interval. OurAddr: 193.24.225.56 Local Diag: 0, Demand mode: 0, Poll bit: 0 MinTxInt: 1000000, MinRxInt: 1000000, Multiplier: 3 Received MinRxInt: 1000000, Received Multiplier: 3 Holddown (hits): 0(0), Hello (hits): 1000(4171) Rx Count: 4175, Rx Interval (ms) min/max/avg: 1/1000/880 last: 580 ms ago Tx Count: 4173, Tx Interval (ms) min/max/avg: 1/1004/876 last: 732 ms ago Elapsed time watermarks: 0 0 (last: 0) Registered protocols: OSPF Uptime: 01:01:03 Last packet: Version: 1 - Diagnostic: 0 State bit: Up - Demand bit: 0 Poll bit: 0 - Final bit: 0 Multiplier: 3 - Length: 24 My Discr.: 8 - Your Discr.: 1 Min tx interval: 1000000 - Min rx interval: 1000000 Min Echo interval: 250000 |

OCSP Stapling
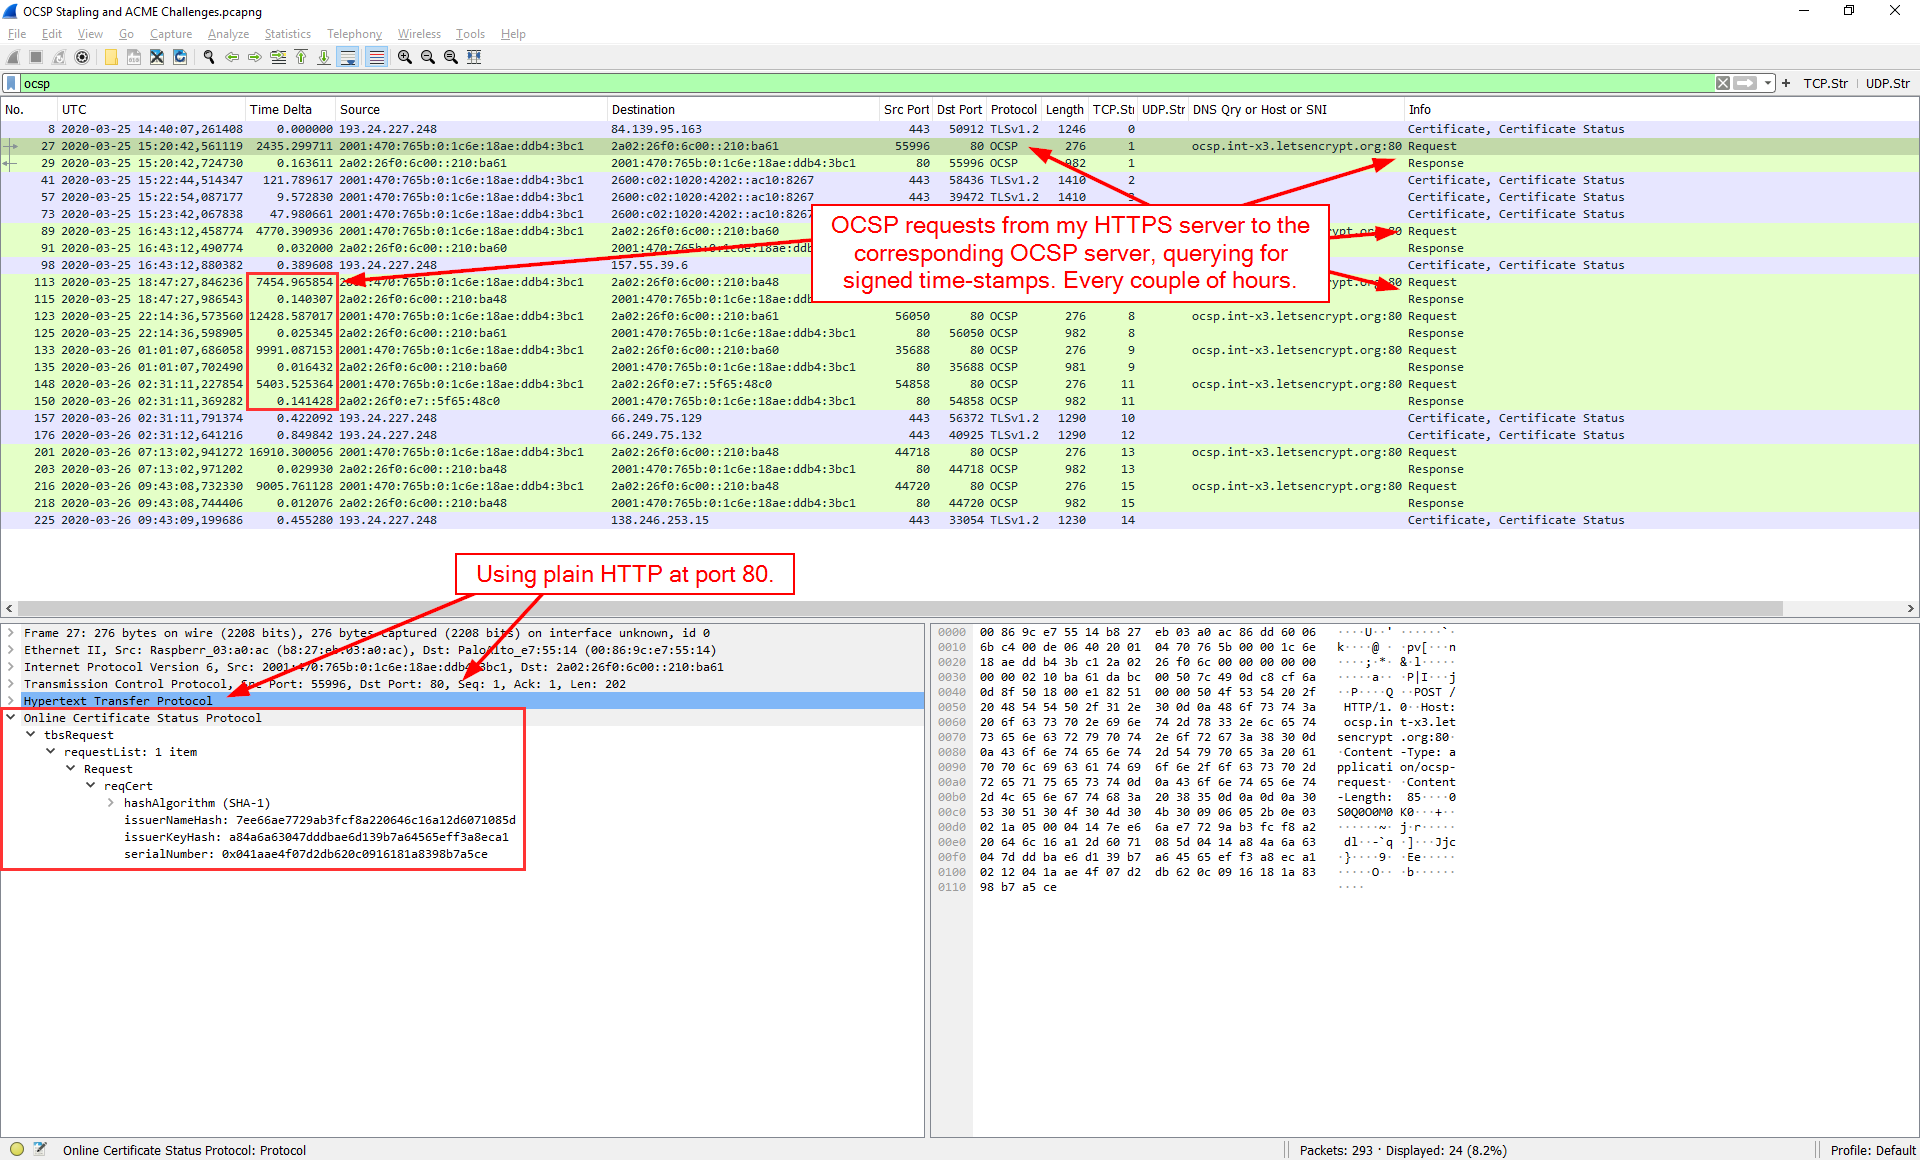
You can find some OCSP related packets in the Ultimate PCAP, divided into two parts:
- the OCSP requests sent from my server (Raspi that hosts random.weberlab.de and ip.webernetz.net) to the Let’s Encrypt OCSP server in order to get signed time-stamps, and
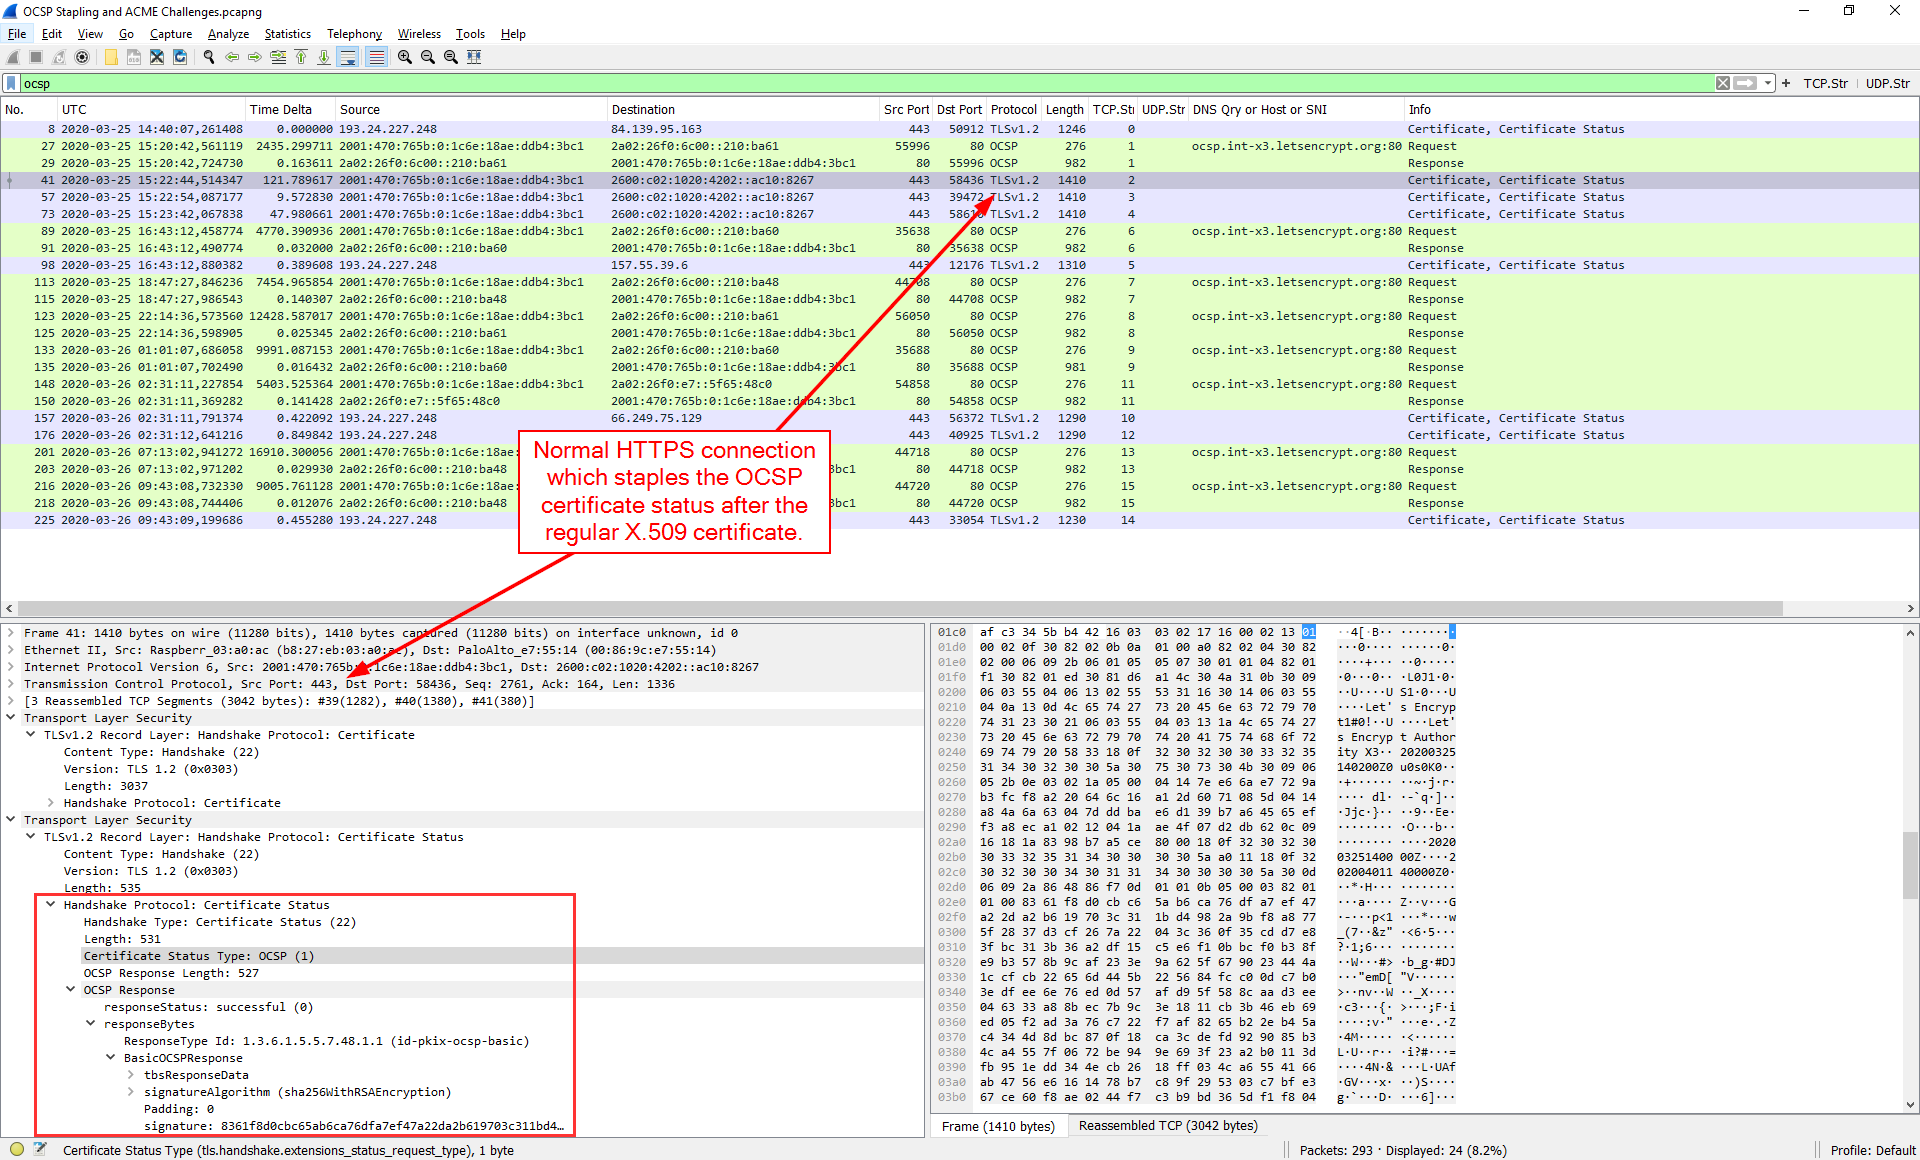
- some regular HTTPS connections to my Raspi, which queried the OCSP stapling in conjunction with the normal X.509 certificate.
You will find both types by using the “ocsp” display filter. Note that this does not display the whole TCP/TLS connections, but only the OCSP parts. Furthermore note, that the stapled certificate status within the TLS connection is not the OCSP protocol, but only a TLS record layer.
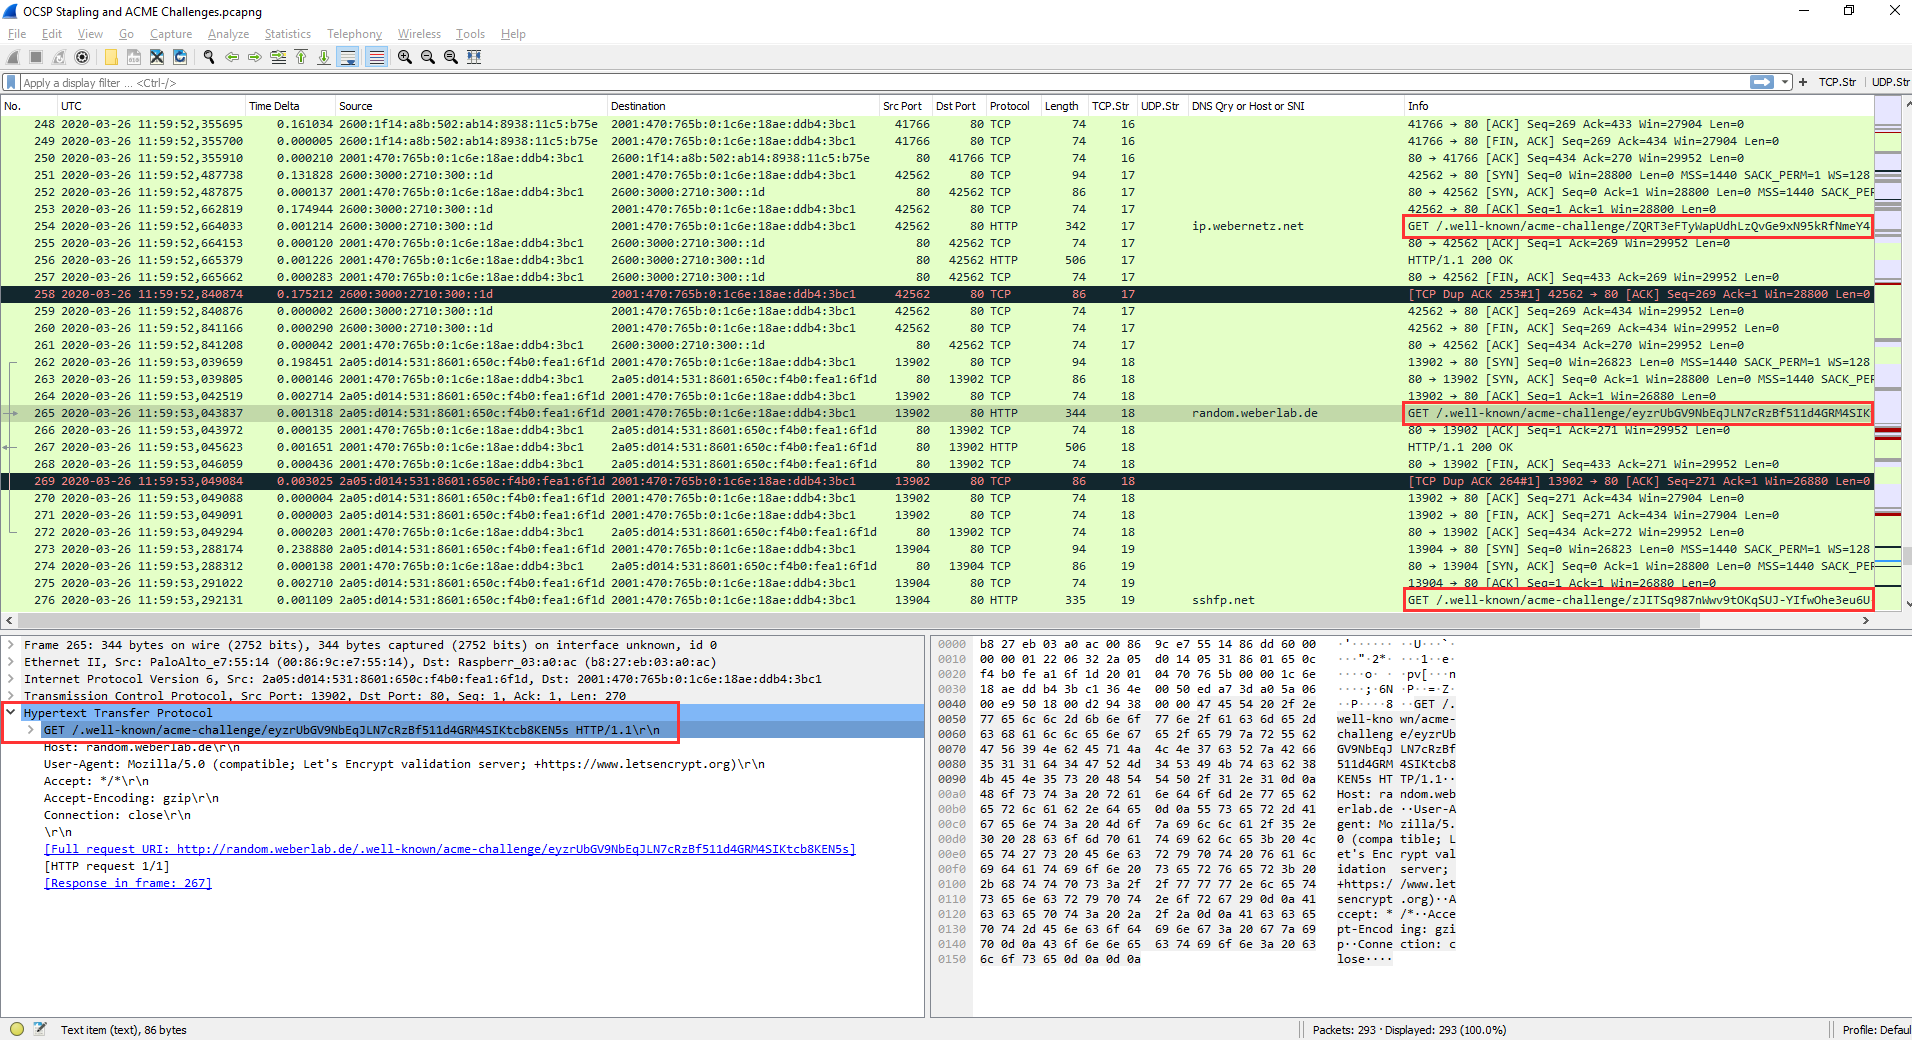
ACME Challenge
Ok, this is not an own network protocol but uses HTTP for its challenge. Hence it does not have an own Wireshark dissector or the like. The HTTP-01 Automatic Certificate Management Environment (ACME) protocol challenges are in plain text HTTP on port 80. I found them in a packet capture at the Raspberry Pi that hosts random.weberlab.de and ip.webernetz.net (among others). You’ll find several short HTTP sessions requesting the well-known “/.well-known/acme-challenge/<TOKEN>” path:
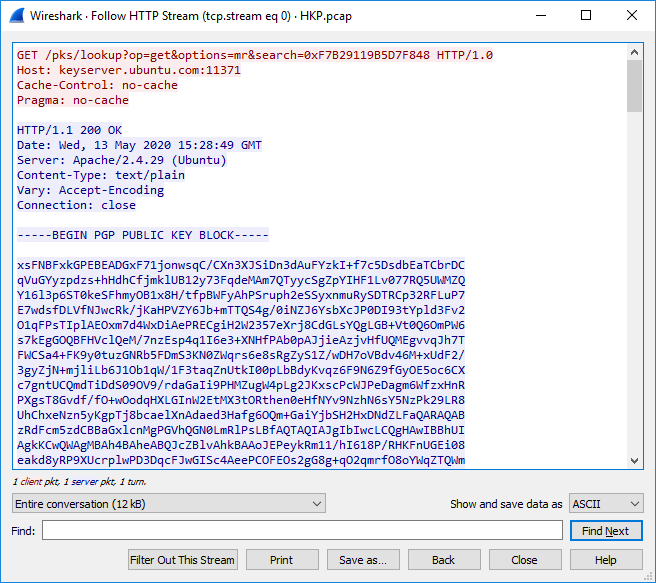
OpenPGP HTTP Keyserver Protocol (HKP)
The keyserver protocol HKP is used to transfer OpenPGP keys to/from a keyserver. I am using it within my Enigmail plugin for Thunderbird. Actually, it’s not a real protocol but HTTP on port 11371. It even doesn’t have a Wikipedia article (as of 2020) nor an own Wireshark dissector. ;) Wireshark lists it as HTTP:

While following the TCP- or HTTP-Stream you can see the mere transfer of an OpenPGP public key:
HTTPS Reconnect / Session Resumption
Again, this is not really an own protocol, but a small variance in how HTTPS aka TLS is used: with session resumption. Tested with:
|
1 |
openssl s_client -connect www.heise.de:443 -showcerts -reconnect |
Find it with display filter: ipv6.addr eq 2001:470:1f0b:16b0:221:70ff:feb2:e6c and ipv6.addr eq 2a02:2e0:3fe:1001:7777:772e:2:85:


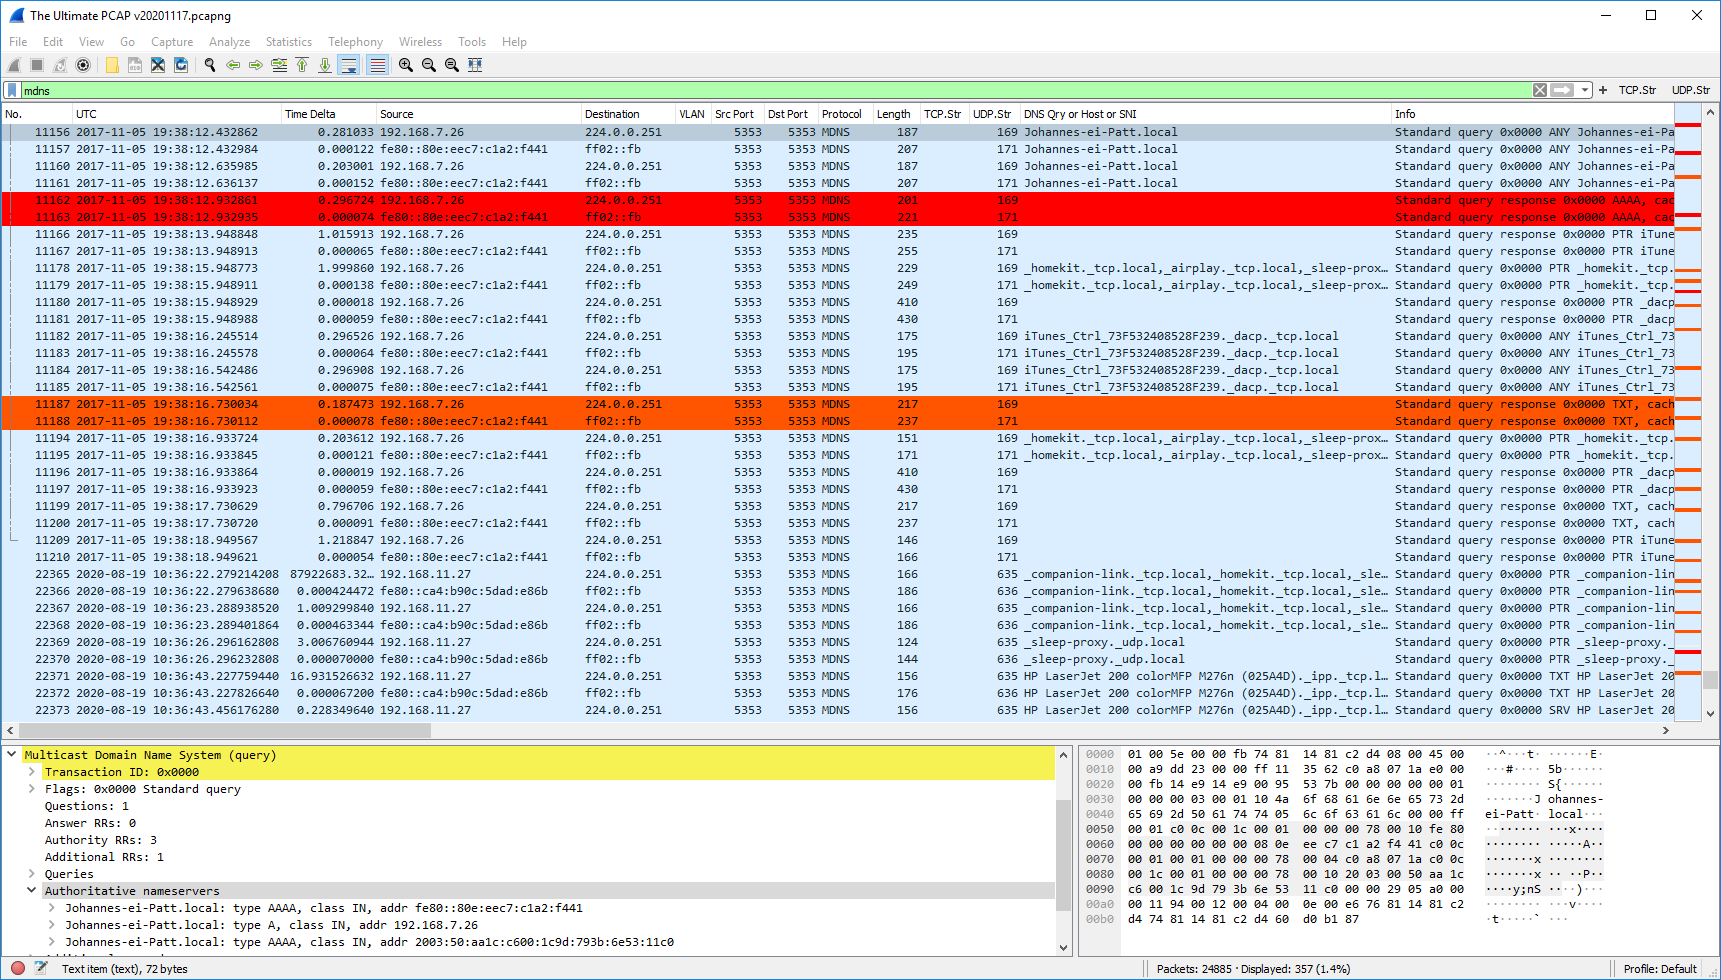
mDNS
Haha, funny, I wasn’t even aware that I had mDNS packets in my trace until I stumbled upon it by accident. ;) AFAIK they were all sourced by Apple devices during my captures for AirPlay and AirPrint. Legacy IP and IPv6 traffic, sourced and destined to UDP port 5353:
Miscellaneous: Negative Delta Times
This is not a protocol at all, but a strange observation in Wireshark: negative delta times. What? How? Have a look at the connections between:
|
1 |
ipv6.addr eq 2a02:26f0:6c00::210:ba48 and ipv6.addr eq 2001:470:765b:0:1c6e:18ae:ddb4:3bc1 |
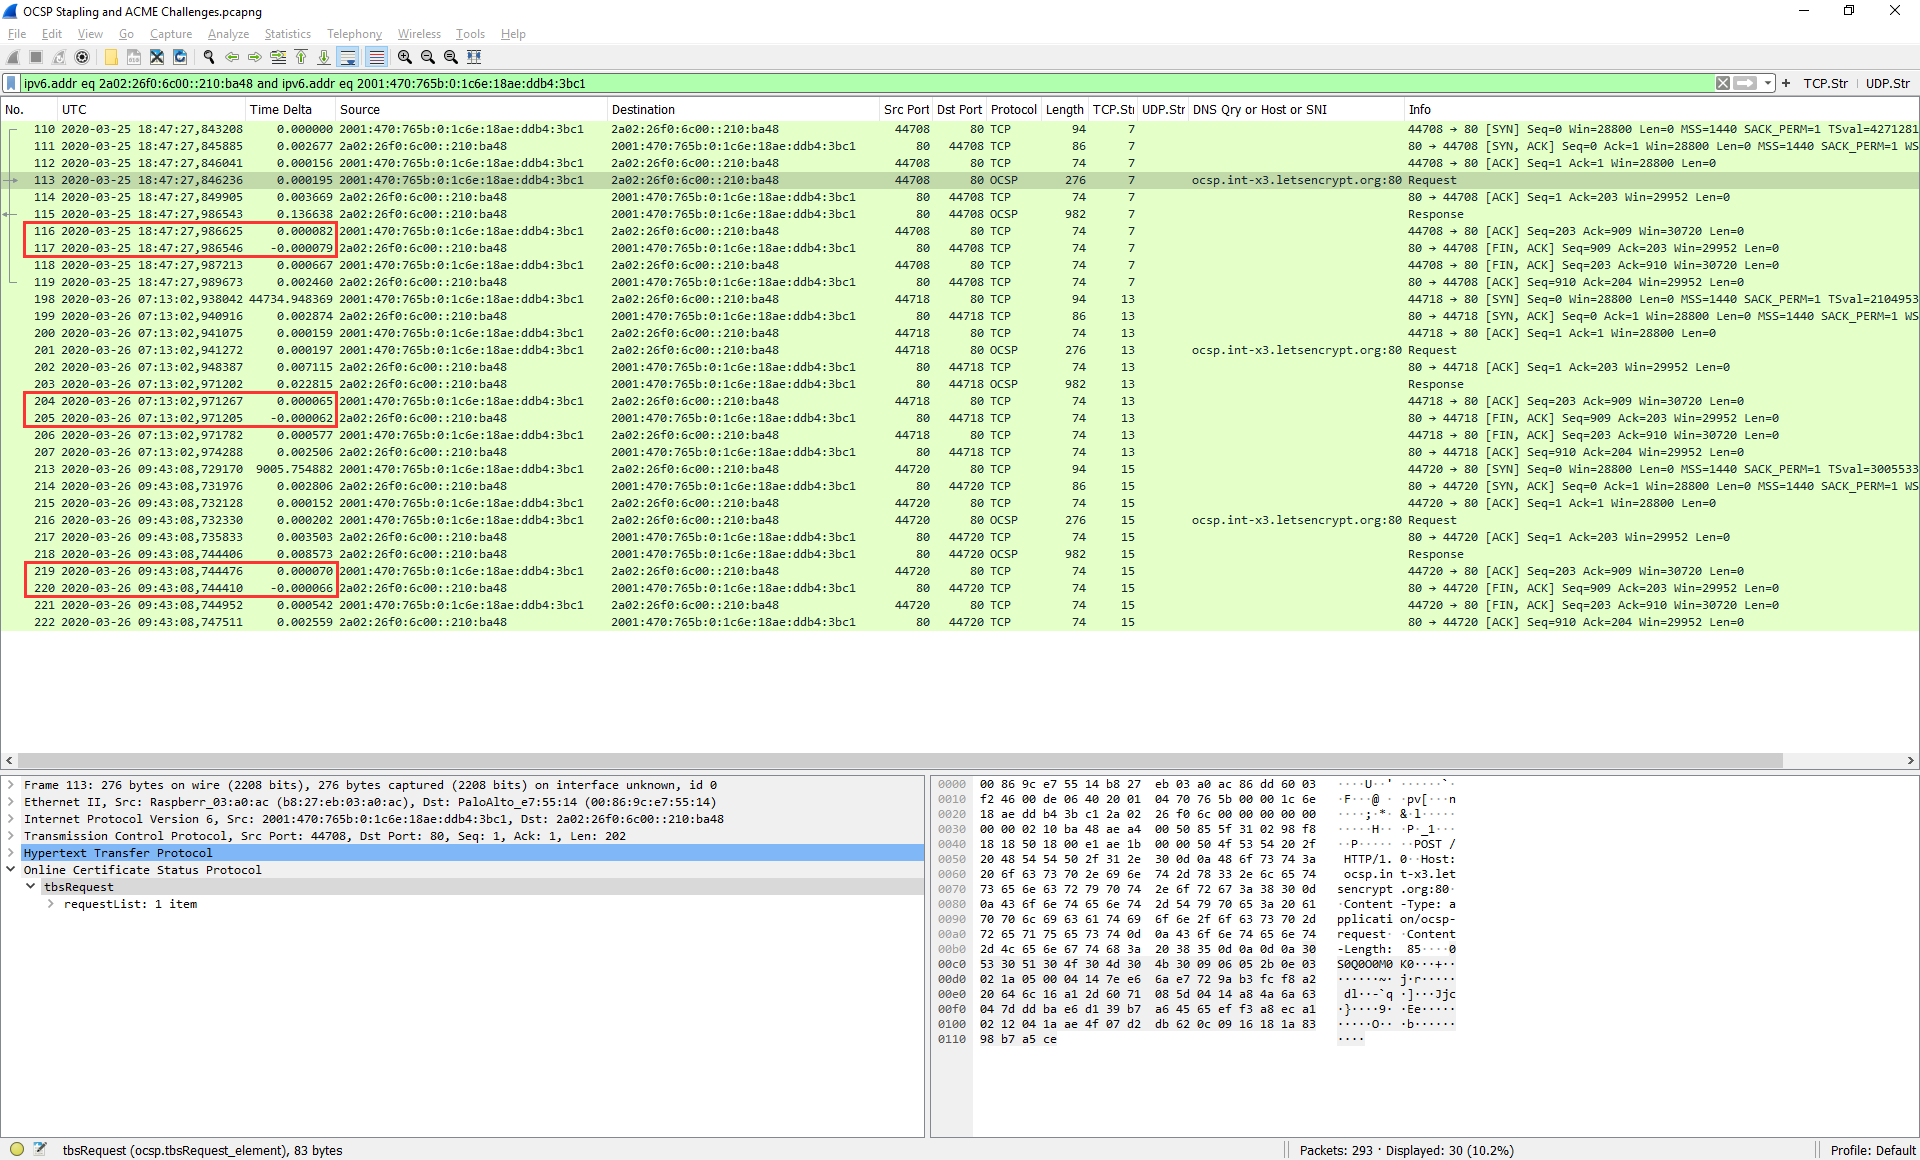
I had a little discussion on Twitter, while Sake Blok from SYN-bit finally sent me some notes about it:
– never capture on one of the hosts if you really need to know how things look on the network
– use a dedicated capture device/NIC that does time stamping in hardware when timestamps are important (like the ProfiShark)
Thank you, Sake!