Since a few weeks I am using Tufin SecureTrack in my lab. A product which analyzes firewall policies about their usage and their changes by administrators (and much more). Therefore, the first step is to connect the firewalls to SecureTrack in two directions: SSH from SecureTrack to the device to analyze the configuration, as well as Syslog from the device to SecureTrack to real-time monitor the policy usage.
This blog post shows the adding of the following firewalls into Tufin: Cisco ASA, Fortinet FortiGate, Juniper ScreenOS, and Palo Alto PA.
I am running TufinOS 2.10 on a virtual machine. The Tufin Orchestration Suite (SecureTrack, etc.) is version R15-3.
Pre Note: No IPv6
Though the Tufin appliance can be configured with an IPv6 address, it is not able to communicate with firewalls via IPv6. All connections must traverse via the legacy Internet Protocol. I asked the Tufin support about that, which replied with: “It is not part of the current IPv6 plans, nor any road-map we are aware of.” Oh oh. At least IPv6 network objects can be analyzed, which is the main part of using SecureTrack. For the other features, I mailed a few feature requests to Tufin.
Start monitoring a new device
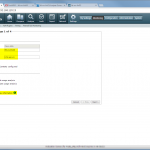
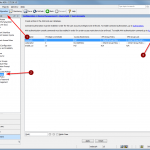
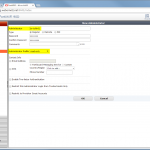
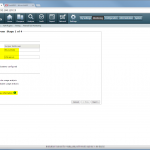
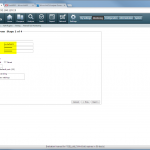
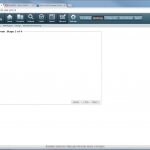
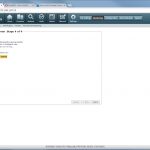
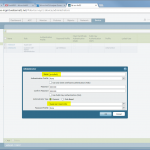
The configuration steps to add a new device are always the same. Under Settings -> Monitoring -> Manage Devices, select the device type under “Start monitoring a new device” and continue. Give the device a name and set the IP address to which Tufin should connect to. Since I am running OSPF as well as OSPFv3 between all of my firewalls, I am always enabling the “Collect dynamic topology information” feature. Finally, enter the login credentials for connecting via ssh to the firewall. I am always creating a new read-only user for Tufin. The “Monitoring Settings” configuration can be left as default.
The second step is to send syslog messages from each device to Tufin. This is solely done at the firewalls. Of course, all intermediate routers/firewalls must allow the traffic for ssh and syslog between Tufin and the monitored devices.
Cisco ASA
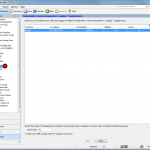
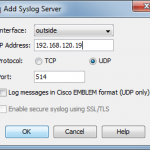
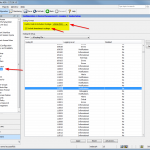
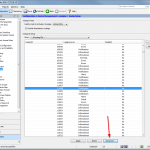
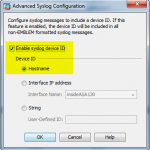
These are the steps for connecting to a Cisco ASA firewall via ssh and syslog. (ASA 5505, 9.2(4)).
Fortinet FortiGate
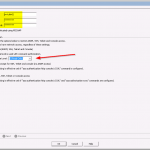
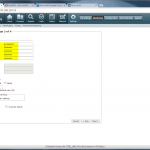
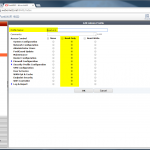
The ssh connection for a FortiGate is configured through the GUI. (FortiWiFi 90D, v5.2.4, build688).
Since I am already using a syslog-ng server, and since only one syslog server is configurable through the FortiGate GUI (oh Fortinet, why aren’t you improving your GUI?), this must be done via the CLI:
|
1 2 3 4 |
config log syslogd2 setting set status enable set server "192.168.120.19" end |
Note that the facility must be set to “local7”. This is the default. However, if you have changed it before, revert it to local7 by the following command within the syslogd setting:
|
1 |
set facility local7 |
Juniper ScreenOS
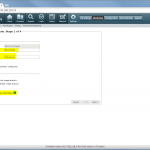
The SSG firewalls are listed as “Juniper NetScreen” within Tufin. These are the steps. (SSG 5, 6.3.0r20.0).
Palo Alto PA
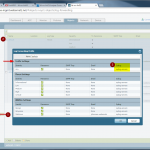
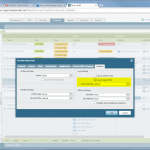
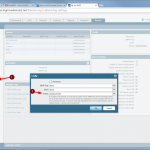
Finally, the Palo Alto. Note that every security policy rule needs the log forwarding profile attached. Furthermore, the “Config” log messages can be sent to Tufin, too. (PA-200, PAN-OS 7.0.3).
Verifying Syslog
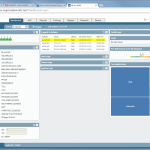
If you want to have the rule and object usage analysis, it is crucial that Tufin receives syslog messages. But after adding a new monitored device, the appropriate icon turns green even though no syslog messages are received yet. Only after some time it will get yellow to warn that “Usage data is not being saved”, if there is no receiving of syslog messages.
If you want to verify that syslog messages are received by Tufin, use tcpdump from the CLI:
|
1 2 3 |
[root@jw-tufin01 ~]# tcpdump -i eth0 -vv -w /tmp/syslog.log -s 1500 src 192.168.86.1 and udp dst port 514 tcpdump: listening on eth0, link-type EN10MB (Ethernet), capture size 1500 bytes Got 662 |
Note that it is not relevant that the syslog messages come in from the same source IP address as the device is connected. Under certain circumstances, this can be the case. (E.g., I am connecting to my Juniper firewall via a different vrouter interface than the syslog messages are generated.) Tufin matches the received syslog messages to the correct device.
After some hours/days/weeks of information beeing processed by Tufin SecureTrack, you can analyse the configuration or run certain rule and object policy usage reports.
Featured image “Lampions in Hoi An, Vietnam” by Marco Verch is licensed under CC BY 2.0.



HI,
I have followed all the steps above for the fortinet, but are not getting information in our tufin dashboard.
Could you please assist.