Some time ago I installed a new firewall at the customer’s site. Meanwhile, the customer was interested in the flows that are traversing through the firewall right now. Oh. Good question. Of course, it is easy to filter through log messages of firewalls, but theses logs are only for finished sessions. Yes, there are “session browsers” or the like on all firewalls, but they are not nice and handy to analyze the sessions in real time.
The solution was to bring a network analyzer on a mirror port near the firewall. I decided to use ntopng running on the live Linux distribution Knoppix. Great choice! An old notebook with two network adapters fits perfectly. A handful of commands and you’re done:
Start
I do not leave home without a bootable Knoppix USB stick. ;) If you don’t have one yet – get it right now: Download the Knoppix DVD image and “burn” it to a USB stick with UNetbootin. I am using it on an old notebook with no hard disk anymore – only the USB stick. Furthermore, I am using a second network adapter via the old PCMCIA slot. That is: I can go online through the main network card (eth0) while sniffing silently on a network through the other card (eth1).
After Knoppix has started, the following commands set the second network adapter (eth1) into promiscuous mode and install ntopng. (Note that this only works with the 64-bit version running.)
|
1 2 3 4 |
sudo ifconfig eth1 up sudo ifconfig eth1 promisc sudo apt-get update sudo apt-get install ntopng |
If the network card already has IP addresses via DHCP (IPv4) or SLAAC (IPv6), these addresses can be flushed. Furthermore, IPv6 must be disabled, because otherwise, the next router advertisement will generate a new IPv6 address. Note that these steps are optional. I am doing it that way to have the interface only listening on the network but not sending any packets.
|
1 2 |
sudo ip add flush dev eth1 sudo sysctl -w net.ipv6.conf.eth1.disable_ipv6=1 |
Ntopng automatically starts after the installation. This can be seen with:
|
1 |
ps -A | grep ntopng |
Similarly, the opened web server port (default: 3000) can be viewed:
|
1 |
netstat -l |
–> Open the browser (Iceweasel on Knoppix) and browse to localhost:3000. The default login is admin:admin. Here we go. :) Alternatively, the web server can be accessed from any other host that navigates to the IP address of the eth0 card of the notebook.
Analyze
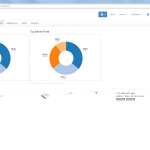
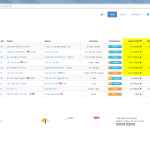
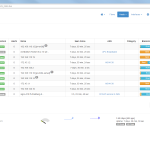
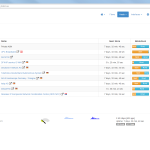
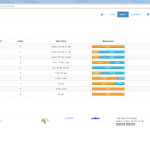
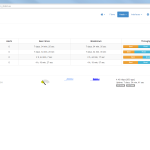
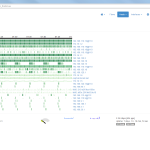
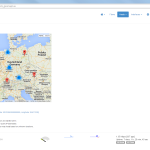
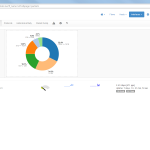
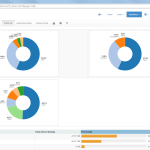
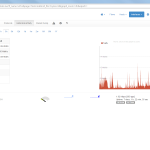
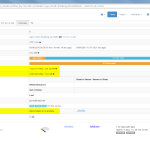
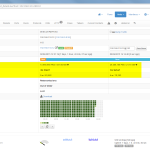
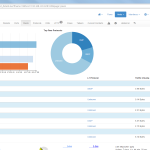
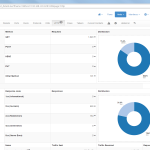
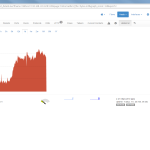
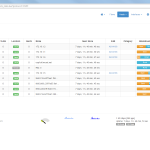
Of course, the second network card must be plugged into a mirror port on a switch in order to analyze the whole network segment. If so, the following statistics can greatly be viewed with ntopng. The most interesting view is the “Flows” page, which shows all current flows, e.g., sorted by bandwidth. However, there is much more to analyze. Refer to the descriptions and highlighted sections of the following screenshots for more details. They are made with the ntopng community version 2.0.150531 (though the packets from Knoppix currently install version 1.2.1):
I’m loving it. ;)
Persist
[UPDATE] I also wrote an article on how to install ntopng on a Ubuntu server. Read it here.[/UPDATE]Of course, ntopng can be installed on a real server in order to run it forever. There are a few installation guides available on the Internet that show how to install it on a Ubuntu server (e.g., here). However, a 64-bit version of the server is mandatory to install ntopng that easily.
More Information
If you want to have more information, watch this presentation from Luca Deri:
Featured image: “magnifier” by harusday is licensed under CC BY-NC-ND 2.0.



One thought on “Out of the Box Network Analyzer “ntopng””