Since almost two years I am running a RIPE Atlas Probe in my server room. It resides in an own security zone on a Palo Alto firewall (which also powers the probe via its USB port :)). With this post I publish a few traffic statistics about the RIPE Atlas Probe.
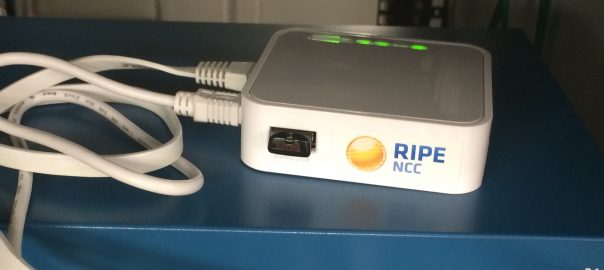
Back in August 2014 I started the RIPE Atlas probe in my lab, of course dual-stacked (IPv6 and legacy IP) and with a 24/7 uptime. (If you are interested in how the RIPE Atlas tool can be used to test servers on the Internet, have a look at this blog post.) I am hosting Probe #19341. Here is a picture of the hardware (Twitter Tweet @2014-08-28):
Just started my @RIPE_Atlas probe, powered by an @PaloAltoNtwks firewall ;) pic.twitter.com/19BkUySAKc
— Johannes Weber 🎸 (@webernetz) August 28, 2014
Applications and Destinations
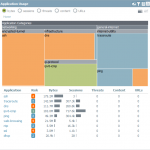
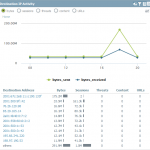
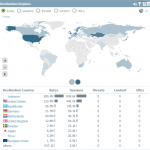
And, as always, I am interested in some statistics of it. ;) Since the Palo Alto firewall offers a great “Application Visibility & Control” feature, it was easy to get some basic statistics about the bandwidth and application usage. The following graphs are generated over a 2-week range about all sessions that were generated by the probe. See the descriptions below the graphs:
Some facts (absolute values over two weeks):
- 175 MB SSH traffic, 3 sessions (-> this is a firmware version upgrade from the probe since the destination IPv6 address has a PTR of “ctr-ams06.atlas.ripe.net”)
- 142 MB traceroute, 307k session
- 112 MB DNS, 260k sessions
- 102 MB pingv6, 717k sessions
- 50 MB pingv4, 360k sessions
Generated Traffic
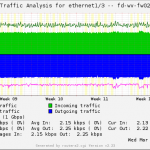
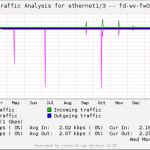
My monitoring system (MRTG with Routers2) also reveals some information about the bandwidth and absolute traffic values. Here are two graphs, the monthly and the yearly one. The monthly shows a straightforward bandwidth usage of 2 kbit/s in both directions, while the yearly shows a few peaks:
The absolute values, measured with MRTG/Routers2 again, are the following (as seen from the firewall interface, i.e., “In” is coming from the probe, while “Out” is traffic to the probe):
|
1 2 3 4 |
Total over rolling last month: In: 673.44 Mbytes Out: 705.04 Mbytes 95th Percentile for rolling last month: In: 2.22 kbps Out: 2.36 kbps Total over rolling last year: In: 8.05 Gbytes Out: 8.28 Gbytes 95th Percentile for rolling last year: In: 2.17 kbps Out: 2.29 kbps |
That is: Over one year, the probe sent 8,05 GB and received 8,28 GB to/from the Internet. In sum, it’s 16,33 GB/y = 45,81 MB/d = 1,91 MB/h = 0,54 KB/s. This is 4,34 kbit/s. Due to the RIPE Atlas FAQs (How much bandwidth will the probe consume?), “an IPv4+IPv6 probe uses approximately 6 kb/s with some user-defined measurements assigned to it.” This seems to be correct.

Very informative post .Really i like it . thanks for sharing with all of us .