Monitoring a Meinberg LANTIME appliance is much easier than monitoring DIY NTP servers. Why? Because you can use the provided enterprise MIB and load it into your SNMP-based monitoring system. Great. The MIB serves many OIDs such as the firmware version, reference clock state, offset, client requests, and even more specific ones such as “correlation” and “field strength” in case of my phase-modulated DCF77 receiver (which is called “PZF” by Meinberg). And since the LANTIME is built upon Linux, you can use the well-known system and interfaces MIBs as well for basic coverage. Let’s dig into it:
Tag Archives: MRTG
Monitoring a GPS NTP Server
Beyond monitoring Linux OS and basic NTP statistics of your stratum 1 GPS NTP server, you can get some more values from the GPS receiver itself, namely the number of satellites (active & in view) as well as the GPS fix and dilution of precision aka DOP. This brings a few more graphs and details. Nice. Let’s go:
Monitoring a DCF77 NTP Server
Now that you’re monitoring the Linux operating system as well as the NTP server basics, it’s interesting to have a look at some more details about the DCF77 receiver. Honestly, there is only one more variable that gives a few details, namely the Clock Status Word and its Event Field. At least you have one more graph in your monitoring system. ;)
Counting NTP Clients
Wherever you’re running an NTP server: It is really interesting to see how many clients are using it. Either at home, in your company or worldwide at the NTP Pool Project. The problem is that ntp itself does not give you this answer of how many clients it serves. There are the “monstats” and “mrulist” queries but they are not reliable at all since they are not made for this. Hence I had to take another path in order to count NTP clients for my stratum 1 NTP servers. Let’s dig in:
Basic NTP Server Monitoring
Now that you have your own NTP servers up and running (such as some Raspberry Pis with external DCF77 or GPS times sources) you should monitor them appropriately, that is: at least their offset, jitter, and reach. From an operational/security perspective, it is always good to have some historical graphs that show how any service behaves under normal circumstances to easily get an idea about a problem in case one occurs. With this post I am showing how to monitor your NTP servers for offset, jitter, reach, and traffic aka “NTP packets sent/received”.
RIPE Atlas Probe Stats
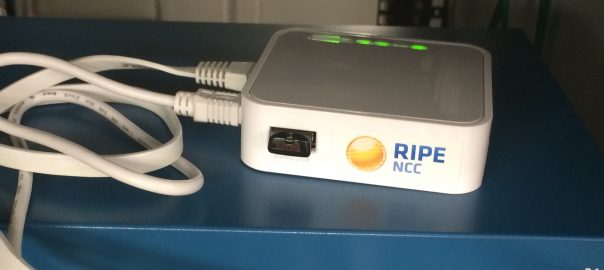
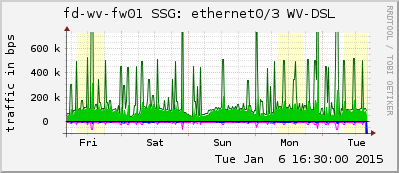
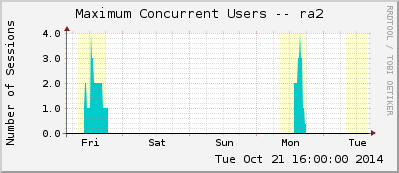
Since almost two years I am running a RIPE Atlas Probe in my server room. It resides in an own security zone on a Palo Alto firewall (which also powers the probe via its USB port :)). With this post I publish a few traffic statistics about the RIPE Atlas Probe.
MRTG/Routers2: Template FortiGate
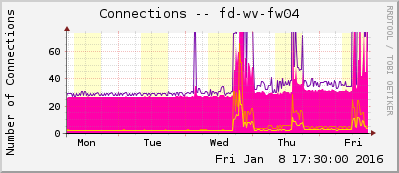
A few weeks ago I constructed an MRTG/Routers2 template for the Fortinet FortiGate firewalls. I am using it for monitoring the FortiGate from my MRTG/Routers2 server. With the basic MRTG tool “cfgmaker” all graphs for the interfaces are generated automatically. My template is an add-on that appends graphs for CPU, memory, and disk usage, as well as connections and VPN statistics. Furthermore, it implements the ping statistics graph and a “short summary”, which only shows the system relevant graphs.
MRTG/Routers2: Template Juniper SSG
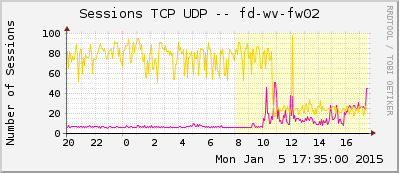
Finally, this is how I am monitoring my Juniper ScreenOS SSG firewalls with MRTG/Routers2. Beside the interfaces (that can be built with cfgmaker) I am using my template in order to monitor the CPU & memory, count of sessions & VPNs, count of different kind of attacks, etc.
MRTG/Routers2: Template Juniper SA/MAG
I am monitoring an (old) SA-2000 cluster of Juniper Secure Access devices with my MRTG/Routers2 system. With the JUNIPER-IVE-MIB I built the configuration file for that monitoring system. In this blog post, I show the graphs generated with MRTG/Routers2 and publish my cfg file as a template.
MRTG/Routers2: Template Palo Alto
Here is my MRTG/Routers2 configuration for a Palo Alto Networks PA-200 firewall. It uses all available OIDs from the PAN-MIB. With a few search-and-replace runs, this template can be used in many other scenarios.
MRTG/Routers2: Template Cisco ASA
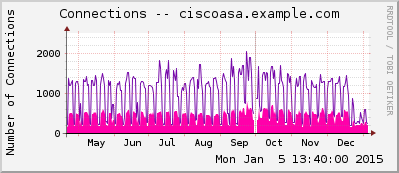
I constructed a MRTG/Routers2 configuration template for the Cisco ASA firewall which consists the OIDs (graphs) for the interfaces, CPU, memory, VPNs, connections, ping times, and traceroute hop counts. With only four search-and-replace changes as well as a few further specifications, the whole SNMP monitoring for that firewall is configured.
Stromzähler mit S0-Schnittstelle vom Raspberry Pi auswerten
Endlich ist es soweit: Ich lese den Stromverbrauch von unserer Wohnung mit einem Raspberry Pi aus und lasse mir von meinem Monitoring Server (MRTG + Routers2) schöne Graphen malen. Hierfür verwende ich einen Stromzähler mit einer S0-Schnittstelle, welchen ich direkt in der Unterverteilung eingebaut habe. Die Impulse des “Smart Meters” wertet eine Interruptroutine am Pi aus. Der Monitoring Server wiederum fragt den Pi per SNMP ab. Viele kleine Schritte also, die ich in diesem Blogpost ausführlich erläutern möchte. Viel Spaß damit!
Continue reading Stromzähler mit S0-Schnittstelle vom Raspberry Pi auswerten
MRTG/Routers2: Template MessPC Ethernetbox
Eine sehr praktische Variante, möglichst viele Sensoren übers Netzwerk abzufragen ohne dabei viel basteln zu müssen, ist die Ethernetbox von MessPC. Man kann sie zum Beispiel mit mehreren kombinierten Temperatur/Luftfeuchtigkeits-Sensoren bestücken. Die Auswertung erfolgt am besten über ein zentrales Monitoring-System.
Auf der Homepage von MessPC befindet sich zwar eine kleine Dokumentation für die Verwendung von MRTG, allerdings wird dort ein zusätzliches Skript vorgestellt, was dank der Verwendung von SNMP ja gar nicht nötig ist. Deswegen poste ich hier mein Template von einem MessPC mit zwei Kombisensoren für Temperatur/Luftfeuchtigkeit, welches für die Verwendung mit MRTG und Routers2 gemäß meiner Installation geeignet ist. Mit nur drei Suchen-und-Ersetzen Durchläufen hat man das Template angepasst.
Measuring Temperatures with PCsensor’s TEMPerHUM Sensor
I am always interested in capturing real values via hardware devices in order to generate the appropriate graphs with my monitoring system. Of course, the outside temperature in our city was at the pole position for such a project. Therefore I ordered a few temperature/humidity sensors from PCsensor (via eBay), plugged them via USB on my Raspberry Pi (Raspbian Linux), and queried them via SNMP from my MRTG/Routers2 monitoring server. Here is the whole story:
Continue reading Measuring Temperatures with PCsensor’s TEMPerHUM Sensor
MRTG/Routers2: Statistiken für AVM’s FRITZ!Box
Natürlich wollte ich auch Statistiken von der FRITZ!Box in meiner MRTG/Routers2-basierten Monitoring Umgebung haben. Glücklicherweise habe ich ein Tool namens upnp2mrtg gefunden, welches exakt das macht, nämlich die Interface-Statistik des WAN Ports der FRITZ!Box über UPnP abzufragen und für MRTG aufzubereiten. Sehr einfach zu benutzen. Hier also eine Anleitung mit einigen zusätzlichen Hinweisen.
Continue reading MRTG/Routers2: Statistiken für AVM’s FRITZ!Box