Wherever you’re running an NTP server: It is really interesting to see how many clients are using it. Either at home, in your company or worldwide at the NTP Pool Project. The problem is that ntp itself does not give you this answer of how many clients it serves. There are the “monstats” and “mrulist” queries but they are not reliable at all since they are not made for this. Hence I had to take another path in order to count NTP clients for my stratum 1 NTP servers. Let’s dig in:
Not: monstats & mrulist
If you are running an NTP server with just a few clients (let’s say: up to 100), you can use the monstats and mrulist queries to get the number of clients and their addresses. However, you should NOT use those queries on NTP servers that are under high load. They will take minutes to finish and the results are not reliable at all.
|
1 2 3 4 5 6 7 8 9 10 11 12 |
ntpq> monstats enabled: 0x3 addresses: 12780 peak addresses: 12780 maximum addresses: 14563 reclaim above count: 600 reclaim older than: 64 kilobytes: 899 maximum kilobytes: 1024 ntpq> mrulist Ctrl-C will stop MRU retrieval and display partial results. 1362 (0 updates) |
I tried monitoring my NTP servers with the “maximum addresses” output from the monstats query, but the numbers weren’t exact at all. Even adjusting the “reclaim above count” and “reclaim older than” did not succeed in any way.
Alternative: UFW with grep ‘n sed et al.
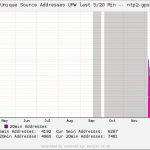
Since my monitoring system (MRTG w/ Routers2 and RRDtool) polls every 5 minutes, I am counting the unique NTP clients during the last 5 minutes. But since common NTP clients increase the query interval up to 1024 seconds = about 17 minutes, those clients will only be listed in the “last 5 minutes” graph every third time. Hence this graph has some ups and downs. Therefore I am counting the unique source addresses over the last 20 minutes as well to get an idea of how many NTP clients are constantly using my NTP server. Note that a one-time peak will be correctly shown in the 5min graph while it will be wrongly displayed for 15 more minutes in the 20min graph. This may happen when investigating DDos attacks or when using the NTP servers within the NTP Pool Project. In summary, I am quite happy with displaying both lines in one graph to have a view about the last 5 minutes as well as a quite realistic value of all clients (20 minutes).
Setting up UFW
Please note that I am operating my NTP servers with IPv6-only. Hence all subsequent commands are mostly IPv6 orientated. If you are still using legacy IP you need to adjust some of those steps.
Have a look at this and that documentation to get an idea. I installed the UFW on some Raspberry Pis as well as some generic Ubuntu Linux servers. Every time remotely via SSH though I would not recommend it that way. ;)
At first, you need to install UFW, add an allow rule for SSH to not cut off your branches, and verify that everything is working up to now:
|
1 2 3 4 5 6 7 8 9 10 11 12 13 14 15 16 17 18 19 20 21 22 23 24 25 26 27 28 29 30 31 32 33 34 35 |
pi@ntp1:~ $ sudo apt-get update pi@ntp1:~ $ sudo apt-get install ufw #The firewall is currently disabled: pi@ntp1:~ $ sudo ufw status Status: inactive #Adding SSH and SNMP to be allowed pi@ntp1:~ $ sudo ufw allow ssh/tcp Rules updated Rules updated (v6) pi@ntp1:~ $ sudo ufw allow snmp/udp Rules updated Rules updated (v6) #You can verify the added rules with: pi@ntp1:~ $ sudo ufw show added Added user rules (see 'ufw status' for running firewall): ufw allow 22/tcp ufw allow 161/udp #Now you can enable it (press y after the first question) and view the status: pi@ntp1:~ $ sudo ufw enable Command may disrupt existing ssh connections. Proceed with operation (y|n)? y Firewall is active and enabled on system startup pi@ntp1:~ $ pi@ntp1:~ $ sudo ufw status Status: active To Action From -- ------ ---- 22/tcp ALLOW Anywhere 161/udp ALLOW Anywhere 22/tcp ALLOW Anywhere (v6) 161/udp ALLOW Anywhere (v6) |
Normally I would have added a “sudo ufw allow ntp/udp” or with logging such as “sudo ufw allow log-all ntp/udp” but in any case, the UFW made a log limit such as “-m limit –limit 3/min –limit-burst 10”. Therefore I added my NTP rules with logging (without limits) and a custom “log-prefix” text to the before6.rules. More information here. That is: sudo nano /etc/ufw/before6.rules and adding the following lines before the last COMMIT:
|
1 2 3 4 |
# HERE IS MY DEFINED RULE ######################################################## # allow ntp/udp with logging all packets -A ufw6-before-input -p udp --dport 123 -j LOG --log-prefix "[UFW ALLOW NTP] " -A ufw6-before-input -p udp --dport 123 -j ACCEPT |
Followed by a sudo ufw reload. Using sudo ufw show raw shows many lines. The chain “ufw6-before-input” now has two more lines at the end:
|
1 2 3 4 5 6 7 8 9 10 11 12 13 14 15 16 17 18 19 20 21 22 23 |
Chain ufw6-before-input (1 references) pkts bytes target prot opt in out source destination 0 0 ACCEPT all lo * ::/0 ::/0 0 0 DROP all * * ::/0 ::/0 rt type:0 segsleft:0 2 144 ACCEPT icmpv6 * * ::/0 ::/0 ipv6-icmptype 135 HL match HL == 255 3 208 ACCEPT icmpv6 * * ::/0 ::/0 ipv6-icmptype 136 HL match HL == 255 0 0 ACCEPT icmpv6 * * ::/0 ::/0 ipv6-icmptype 133 HL match HL == 255 0 0 ACCEPT icmpv6 * * ::/0 ::/0 ipv6-icmptype 134 HL match HL == 255 79 7008 ACCEPT all * * ::/0 ::/0 state RELATED,ESTABLISHED 0 0 ACCEPT icmpv6 * * fe80::/10 ::/0 ipv6-icmptype 129 0 0 ufw6-logging-deny all * * ::/0 ::/0 state INVALID 0 0 DROP all * * ::/0 ::/0 state INVALID 0 0 ACCEPT icmpv6 * * ::/0 ::/0 ipv6-icmptype 1 0 0 ACCEPT icmpv6 * * ::/0 ::/0 ipv6-icmptype 2 0 0 ACCEPT icmpv6 * * ::/0 ::/0 ipv6-icmptype 3 0 0 ACCEPT icmpv6 * * ::/0 ::/0 ipv6-icmptype 4 0 0 ACCEPT icmpv6 * * ::/0 ::/0 ipv6-icmptype 128 0 0 ACCEPT udp * * fe80::/10 fe80::/10 udp spt:547 dpt:546 0 0 ACCEPT udp * * ::/0 ff02::fb udp dpt:5353 0 0 ACCEPT udp * * ::/0 ff02::f udp dpt:1900 0 0 LOG udp * * ::/0 ::/0 udp dpt:123 LOG flags 0 level 4 prefix "[UFW ALLOW NTP] " 0 0 ACCEPT udp * * ::/0 ::/0 udp dpt:123 0 0 ufw6-user-input all * * ::/0 ::/0 |
After a few seconds (depending on the load of your NTP server) the pkts and bytes are increasing:
|
1 2 |
4 384 LOG udp * * ::/0 ::/0 udp dpt:123 LOG flags 0 level 4 prefix "[UFW ALLOW NTP] " 4 384 ACCEPT udp * * ::/0 ::/0 udp dpt:123 |
And the /var/log/syslog shows log entries with the defined [UFW ALLOW NTP] prefix:
|
1 2 3 4 |
pi@ntp1:~ $ tail -f /var/log/syslog | grep 'UFW ALLOW NTP' May 23 10:25:36 ntp1 kernel: [652436.007855] [UFW ALLOW NTP] IN=eth0 OUT= MAC=b8:27:eb:4f:ff:14:b8:27:eb:d1:52:26:86:dd:6b:80:00:00:00:38:11:40:20:03:00:51 SRC=2003:0051:6012:0110:0000:0000:06b5:0123 DST=2003:0051:6012:0110:0000:0000:dcf7:0123 LEN=96 TC=184 HOPLIMIT=64 FLOWLBL=0 PROTO=UDP SPT=123 DPT=123 LEN=56 May 23 10:25:56 ntp1 kernel: [652456.918946] [UFW ALLOW NTP] IN=eth0 OUT= MAC=b8:27:eb:4f:ff:14:b4:0c:25:05:8e:13:86:dd:60:00:00:00:00:38:11:36:20:01:09:84 SRC=2001:0984:aee9:0006:fad1:11ff:fea0:2b2e DST=2003:0051:6012:0110:0000:0000:dcf7:0123 LEN=96 TC=0 HOPLIMIT=54 FLOWLBL=0 PROTO=UDP SPT=46097 DPT=123 LEN=56 ^C |
Perfect! ;)
Counting Source IP Addresses
With some small shell commands, you can extract the source IPv6 address only, sort it, list only unique addresses, and count it. You will get something like this:
|
1 2 |
pi@ntp1:~ $ cat /var/log/syslog | grep 'UFW ALLOW NTP' | sed s/.*SRC=// | sed s/.DST.*// | sort | uniq | wc -l 20 |
After a RIPE Atlas measurement with 50 clients I got this:
|
1 2 |
pi@ntp1:~ $ cat /var/log/syslog | grep 'UFW ALLOW NTP' | sed s/.*SRC=// | sed s/.DST.*// | sort | uniq | wc -l 68 |
Great!
Now I wanted to grep all addresses from the last 5 minutes since my default MRTG/Routers2 installation polls every 5 minutes. That is, I want to know the count of unique IPv6 source addresses during a period of 5 minutes. I found a great awk command that extracts the last 5 minutes by Alfred Tong which worked out of the box:
|
1 |
awk -v d1="$(date --date="-5 min" "+%b %_d %H:%M")" -v d2="$(date "+%b %_d %H:%M")" '$0 > d1 && $0 < d2 || $0 ~ d2' /var/log/syslog |
Combined with my grep sort uniq wc command it is this. Hence I’m getting the count of unique addresses during the last 5 minutes. Yeah. Since the default syslog file is rotated every day I am grepping through both logfiles, the current one and the one from yesterday with the “.1” extension. (Though this is only needed for correct stats for a few minutes a day, the script reads both files completely at every execution. But I don’t care. ;))
|
1 2 |
pi@ntp1:~ $ awk -v d1="$(date --date="-5 min" "+%b %_d %H:%M")" -v d2="$(date "+%b %_d %H:%M")" '$0 > d1 && $0 < d2 || $0 ~ d2' /var/log/syslog /var/log/syslog.1 | grep 'UFW ALLOW NTP' | sed s/.*SRC=// | sed s/.DST.*// | sort | uniq | wc -l 7 |
For getting the “clients during the last 20 minutes” it’s almost the same line, but with “-20 min” instead of the “-5 min” statement.
Monitoring via SNMP
Now that I have the logs and count of clients on the NTP server itself, I wanted to get this data into my monitoring system. I decided to use SNMP and its “EXTENDING THE AGENT” section. But before using SNMP, the user account of the snmpd must be able to read the syslog file. Therefore this user must be added to the “adm” group. Please note that on a newer Raspbian the snmpd was not run anymore by a user called “snmp” but “Debian-snmp”. Hence you must add this user to the adm group:
|
1 2 3 4 |
pi@ntp2-gps:~ $ sudo adduser Debian-snmp adm Adding user `Debian-snmp' to group `adm' ... Adding user Debian-snmp to group adm Done. |
You can now proceed with the SNMP extensions: sudo nano /etc/snmp/snmpd.conf and adding:
|
1 2 |
extend-sh ufwclients awk -v d1="$(date --date="-5 min" "+%b %_d %H:%M")" -v d2="$(date "+%b %_d %H:%M")" '$0 > d1 && $0 < d2 || $0 ~ d2' /var/log/syslog /var/log/syslog.1 | grep 'UFW ALLOW NTP' | sed s/.*SRC=// | sed s/.DST.*// | sort | uniq | wc -l extend-sh ufwclients20 awk -v d1="$(date --date="-20 min" "+%b %_d %H:%M")" -v d2="$(date "+%b %_d %H:%M")" '$0 > d1 && $0 < d2 || $0 ~ d2' /var/log/syslog /var/log/syslog.1 | grep 'UFW ALLOW NTP' | sed s/.*SRC=// | sed s/.DST.*// | sort | uniq | wc -l |
Followed by a: sudo service snmpd restart. From the SNMP server you can walk the OIDs to find the correct ones:
|
1 2 3 4 5 |
snmpwalk -v 2c -c COMMUNITYSTRING udp6:ntp1.weberlab.de .1.3.6.1.4.1.8072.1.3 [...] iso.3.6.1.4.1.8072.1.3.2.4.1.2.10.117.102.119.99.108.105.101.110.116.115.1 = STRING: "12" iso.3.6.1.4.1.8072.1.3.2.4.1.2.12.117.102.119.99.108.105.101.110.116.115.50.48.1 = STRING: "26" [...} |
Note that under heavy load my script takes more than 2 seconds to run. This is no problem for the Pi but for MRTG which uses a default SNMP timeout of 2 seconds. Hence I increased the value to 11 seconds as well as the retries to 5. This value is at the end of the Target line after the second colon, while the last “2” declares SNMP version 2: ::11:5::2:
|
1 |
community@router[:[port][:[timeout][:[retries][:[backoff][:[version]]]]][|name] |
Now let’s have a look at the MRTG Target. Following are two different Targets as a reference, plus one summary graph to sum them up:
|
1 2 3 4 5 6 7 8 9 10 11 12 13 14 15 16 17 18 19 20 21 22 23 24 25 26 27 28 29 30 31 32 33 34 35 36 37 38 39 40 41 42 43 44 45 46 |
############################################################### ###################### Clients via UFW ######################## ############################################################### Target[ntp1-dcf77-ufwclients]: 1.3.6.1.4.1.8072.1.3.2.4.1.2.10.117.102.119.99.108.105.101.110.116.115.1&1.3.6.1.4.1.8072.1.3.2.4.1.2.12.117.102.119.99.108.105.101.110.116.115.50.48.1:JESUSISTHEKEY@ntp1.weberlab.de::11:5::2 MaxBytes[ntp1-dcf77-ufwclients]: 64000 Title[ntp1-dcf77-ufwclients]: Unique Source Addresses UFW last 5/20 Min -- ntp1-dcf77 Colours[ntp1-dcf77-ufwclients]: Pink#FF00AA, Darkpurple#7608AA, Yellow#FFD600, Orange#FC7C01 Options[ntp1-dcf77-ufwclients]: gauge integer YLegend[ntp1-dcf77-ufwclients]: Number of Addresses Legend1[ntp1-dcf77-ufwclients]: 5min Addresses Legend2[ntp1-dcf77-ufwclients]: 20min Addresses Legend3[ntp1-dcf77-ufwclients]: Peak 5min Addresses Legend4[ntp1-dcf77-ufwclients]: Peak 20min Addresses LegendI[ntp1-dcf77-ufwclients]: 5min Addresses: LegendO[ntp1-dcf77-ufwclients]: 20min Addresses: ShortLegend[ntp1-dcf77-ufwclients]: routers.cgi*Options[ntp1-dcf77-ufwclients]: maximum nototal nomax routers.cgi*ShortDesc[ntp1-dcf77-ufwclients]: Clients UFW ntp1-dcf77 routers.cgi*Icon[ntp1-dcf77-ufwclients]: user-sm.gif routers.cgi*InSummary[ntp1-dcf77-ufwclients]: yes routers.cgi*Graph[ntp1-dcf77-ufwclients]: ntp-ufwclients Target[ntp2-gps-ufwclients]: 1.3.6.1.4.1.8072.1.3.2.4.1.2.10.117.102.119.99.108.105.101.110.116.115.1&1.3.6.1.4.1.8072.1.3.2.4.1.2.12.117.102.119.99.108.105.101.110.116.115.50.48.1:JESUSISTHEKEY@ntp2.weberlab.de::11:5::2 MaxBytes[ntp2-gps-ufwclients]: 64000 Title[ntp2-gps-ufwclients]: Unique Source Addresses UFW last 5/20 Min -- ntp2-gps Colours[ntp2-gps-ufwclients]: Pink#FF00AA, Darkpurple#7608AA, Yellow#FFD600, Orange#FC7C01 Options[ntp2-gps-ufwclients]: gauge integer YLegend[ntp2-gps-ufwclients]: Number of Addresses Legend1[ntp2-gps-ufwclients]: 5min Addresses Legend2[ntp2-gps-ufwclients]: 20min Addresses Legend3[ntp2-gps-ufwclients]: Peak 5min Addresses Legend4[ntp2-gps-ufwclients]: Peak 20min Addresses LegendI[ntp2-gps-ufwclients]: 5min Addresses: LegendO[ntp2-gps-ufwclients]: 20min Addresses: ShortLegend[ntp2-gps-ufwclients]: routers.cgi*Options[ntp2-gps-ufwclients]: maximum nototal nomax routers.cgi*ShortDesc[ntp2-gps-ufwclients]: Clients UFW ntp2-gps routers.cgi*Icon[ntp2-gps-ufwclients]: user-sm.gif routers.cgi*InSummary[ntp2-gps-ufwclients]: yes routers.cgi*Graph[ntp2-gps-ufwclients]: ntp-ufwclients routers.cgi*Title[ntp-ufwclients]: NTP Unique Source Addresses UFW last 5/20 Min Summary routers.cgi*ShortDesc[ntp-ufwclients]: Clients UFW Summary routers.cgi*Options[ntp-ufwclients]: nototal noi routers.cgi*Icon[ntp-ufwclients]: user-sm.gif routers.cgi*InSummary[ntp-ufwclients]: yes |
Uff. You’re done. ;) Congratulations!
Sample Graphs
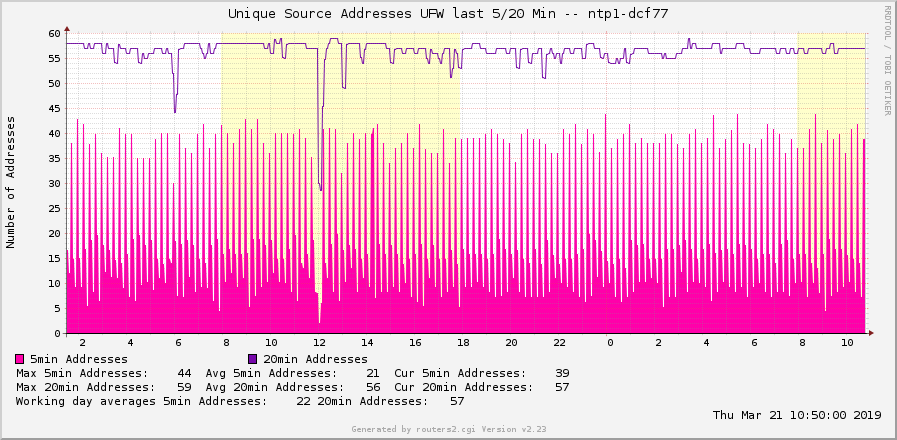
Finally here are some graphs. This one shows normal days with internal NTP clients only (about 50-60). Note the filled pink area that shows the 5 min address count, while the purple line shows the 20 min address count which gives the sum of all current clients:
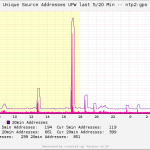
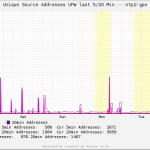
These graps list the clients during NTP Pool Project participation (10 – 50 k!!!). As always you have the daily/weekly/monthly/yearly graphs to either show overviews or more details:
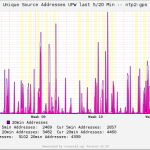
Finally my summary graph over four different NTP servers, showing only the 20 min address counts, daily view:
Cheers!
Featured image “Wer im Alter nicht nur Peanuts zählen will, sollte sich bereits jetzt um ‘ne vernünftige Altersvorsorge kümmern – später bleibt keine Zeit mehr dafür. Und auch wenn das Thema so dröge wie langweilig erscheinen mag, ist es einfach wichtig, sich zu informie” by ppc1337 is licensed under CC BY-SA 2.0.



For realtime stats (no history, no graphs, but realtime), I made this little tool:
https://github.com/mdavids/ntptools/tree/main/ntptraf2
Nice! Thanks for that.
You’re counting the NTPv1, v2, v3, v4 queries. That’s interesting. Do you have some stats which machines still use older than v4 NTP? Any why? I am not aware of any… (Or maybe I haven’t searched enough…)
I can see v1 is still used more or less and v4 is used a lot and at least twice as much as v3, but v2 is used hardly at all (but better check for yourself with my tool ?).
But I am not sure which machines are responsible for this. It would surely be interesting to know. It’s also interesting to see how much IPv6 is used in Germany, thank to the many Fritz!Boxes that have 2.pool.ntp.org configured.