Again and again, I am adding some protocol samples to the Ultimate PCAP. Just for reference. And because I can. ;D


Again and again, I am adding some protocol samples to the Ultimate PCAP. Just for reference. And because I can. ;D

Monitoring a Meinberg LANTIME appliance is much easier than monitoring DIY NTP servers. Why? Because you can use the provided enterprise MIB and load it into your SNMP-based monitoring system. Great. The MIB serves many OIDs such as the firmware version, reference clock state, offset, client requests, and even more specific ones such as “correlation” and “field strength” in case of my phase-modulated DCF77 receiver (which is called “PZF” by Meinberg). And since the LANTIME is built upon Linux, you can use the well-known system and interfaces MIBs as well for basic coverage. Let’s dig into it:

Beyond monitoring Linux OS and basic NTP statistics of your stratum 1 GPS NTP server, you can get some more values from the GPS receiver itself, namely the number of satellites (active & in view) as well as the GPS fix and dilution of precision aka DOP. This brings a few more graphs and details. Nice. Let’s go:

Now that you’re monitoring the Linux operating system as well as the NTP server basics, it’s interesting to have a look at some more details about the DCF77 receiver. Honestly, there is only one more variable that gives a few details, namely the Clock Status Word and its Event Field. At least you have one more graph in your monitoring system. ;)

Wherever you’re running an NTP server: It is really interesting to see how many clients are using it. Either at home, in your company or worldwide at the NTP Pool Project. The problem is that ntp itself does not give you this answer of how many clients it serves. There are the “monstats” and “mrulist” queries but they are not reliable at all since they are not made for this. Hence I had to take another path in order to count NTP clients for my stratum 1 NTP servers. Let’s dig in:

Now that you have your own NTP servers up and running (such as some Raspberry Pis with external DCF77 or GPS times sources) you should monitor them appropriately, that is: at least their offset, jitter, and reach. From an operational/security perspective, it is always good to have some historical graphs that show how any service behaves under normal circumstances to easily get an idea about a problem in case one occurs. With this post I am showing how to monitor your NTP servers for offset, jitter, reach, and traffic aka “NTP packets sent/received”.

Some time ago I published a pcap that can be used to study basic IPv6 protocol messages such as ICMPv6 for Router Advertisements, Neighbor Solicitations, etc.: “Basic IPv6 Messages: Wireshark Capture“. You can use it to learn the basic IPv6 address assignment and layer 2 address resolution. However, that pcap does not include any upper layer protocols.
This time I captured a few application layer protocols that I used over IPv6 rather than over legacy IP. Common user protocols such as DNS, HTTP/S, IMAP, SMTP (with STARTTLS), as well as some network administration protocols: SSH, SNMP, and Ping. It is not that interesting at all ;) though you can use it to have some examples for Wireshark to prove that those application protocols are almost the same when run above IPv6 compared to IPv4.

Following is a list of the most common Cisco device configuration commands that I am using when setting up a router or switch from scratch, such as hostname, username, logging, vty access, ntp, snmp, syslog. For a router, I am also listing some basic layer 3 interface commands, while for a switch I am listing STP and VTP examples as well as the interface settings for access and trunk ports.
This is not a detailed best practice list which can be used completely without thinking about it, but a list with the most common configurations from which to pick out the ones required for the current scenario. Kind of a template. Of course with IPv6 and legacy IP.

Second post of this little series. While I was using my CCNP SWITCH lab for testing many different protocols, I “showed” and saved the output of those protocols as well. Refer to the lab overview of my last post in order to understand those outputs.
I basically saved them as a reference for myself in case I am interested in the information revealed by them. I won’t explain any details of the protocols nor the outputs here. Just many listings. Fly over them and reflect yourself whether you would understand anything. ;) Here we go:

While preparing for my CCNP SWITCH exam I built a laboratory with 4 switches, 3 routers and 2 workstations in order to test almost all layer 2/3 protocols that are related to network management traffic. And because “PCAP or it didn’t happen” I captured 22 of these protocols to further investigate them with Wireshark. Oh oh, I remember the good old times where I merely used unmanaged layer 2 switches. ;)
In this blogpost I am publishing the captured pcap file with all of these 22 protocols. I am further listing 46 CHALLENGES as an exercise for the reader. Feel free to download the pcap and to test your protocol skills with Wireshark! Use the comment section below for posting your answers.
Of course I am running my lab fully dual-stacked, i.e., with IPv6 and legacy IP. On some switches the SDM template must be changed to be IPv6 capable such as sdm prefer dual-ipv4-and-ipv6 default .
Continue reading Wireshark Layer 2-3 pcap Analysis w/ Challenges (CCNP SWITCH)

This is just a small post on how to enable SNMP on a Lastline Advanced Malware Protection appliance in order to query the basic host and network MIBs from an SNMP monitoring server. Note that this is not the preferred method of monitoring a Lastline device. The Product API (PAPI) should be used instead such as shown in the online docs. However, basic SNMP gives access to the CPU, memory, load average and the network interface statistics incl. the anonymous VPN tunnel interface.
Since all Lastline devices are basically a Ubuntu server, the basic setup for SNMP is quite similar to my tutorial for a generic Linux. The only step missing there is the allow statement for the Uncomplicated Firewall (ufw).

A few weeks ago I constructed an MRTG/Routers2 template for the Fortinet FortiGate firewalls. I am using it for monitoring the FortiGate from my MRTG/Routers2 server. With the basic MRTG tool “cfgmaker” all graphs for the interfaces are generated automatically. My template is an add-on that appends graphs for CPU, memory, and disk usage, as well as connections and VPN statistics. Furthermore, it implements the ping statistics graph and a “short summary”, which only shows the system relevant graphs.

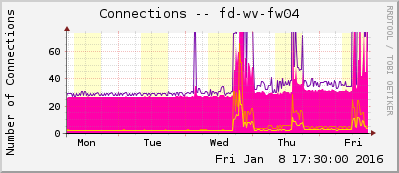
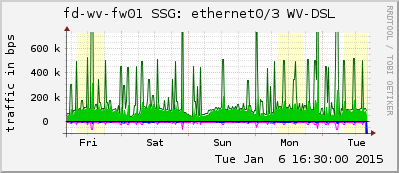
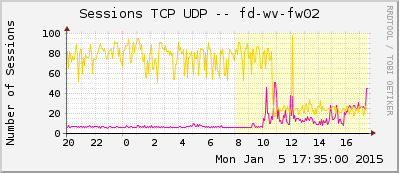
Finally, this is how I am monitoring my Juniper ScreenOS SSG firewalls with MRTG/Routers2. Beside the interfaces (that can be built with cfgmaker) I am using my template in order to monitor the CPU & memory, count of sessions & VPNs, count of different kind of attacks, etc.

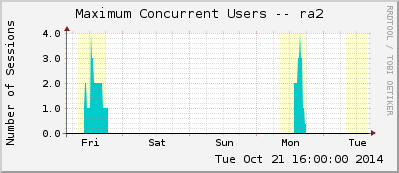
I am monitoring an (old) SA-2000 cluster of Juniper Secure Access devices with my MRTG/Routers2 system. With the JUNIPER-IVE-MIB I built the configuration file for that monitoring system. In this blog post, I show the graphs generated with MRTG/Routers2 and publish my cfg file as a template.

Here is my MRTG/Routers2 configuration for a Palo Alto Networks PA-200 firewall. It uses all available OIDs from the PAN-MIB. With a few search-and-replace runs, this template can be used in many other scenarios.