
Again and again, I am adding some protocol samples to the Ultimate PCAP. Just for reference. And because I can. ;D
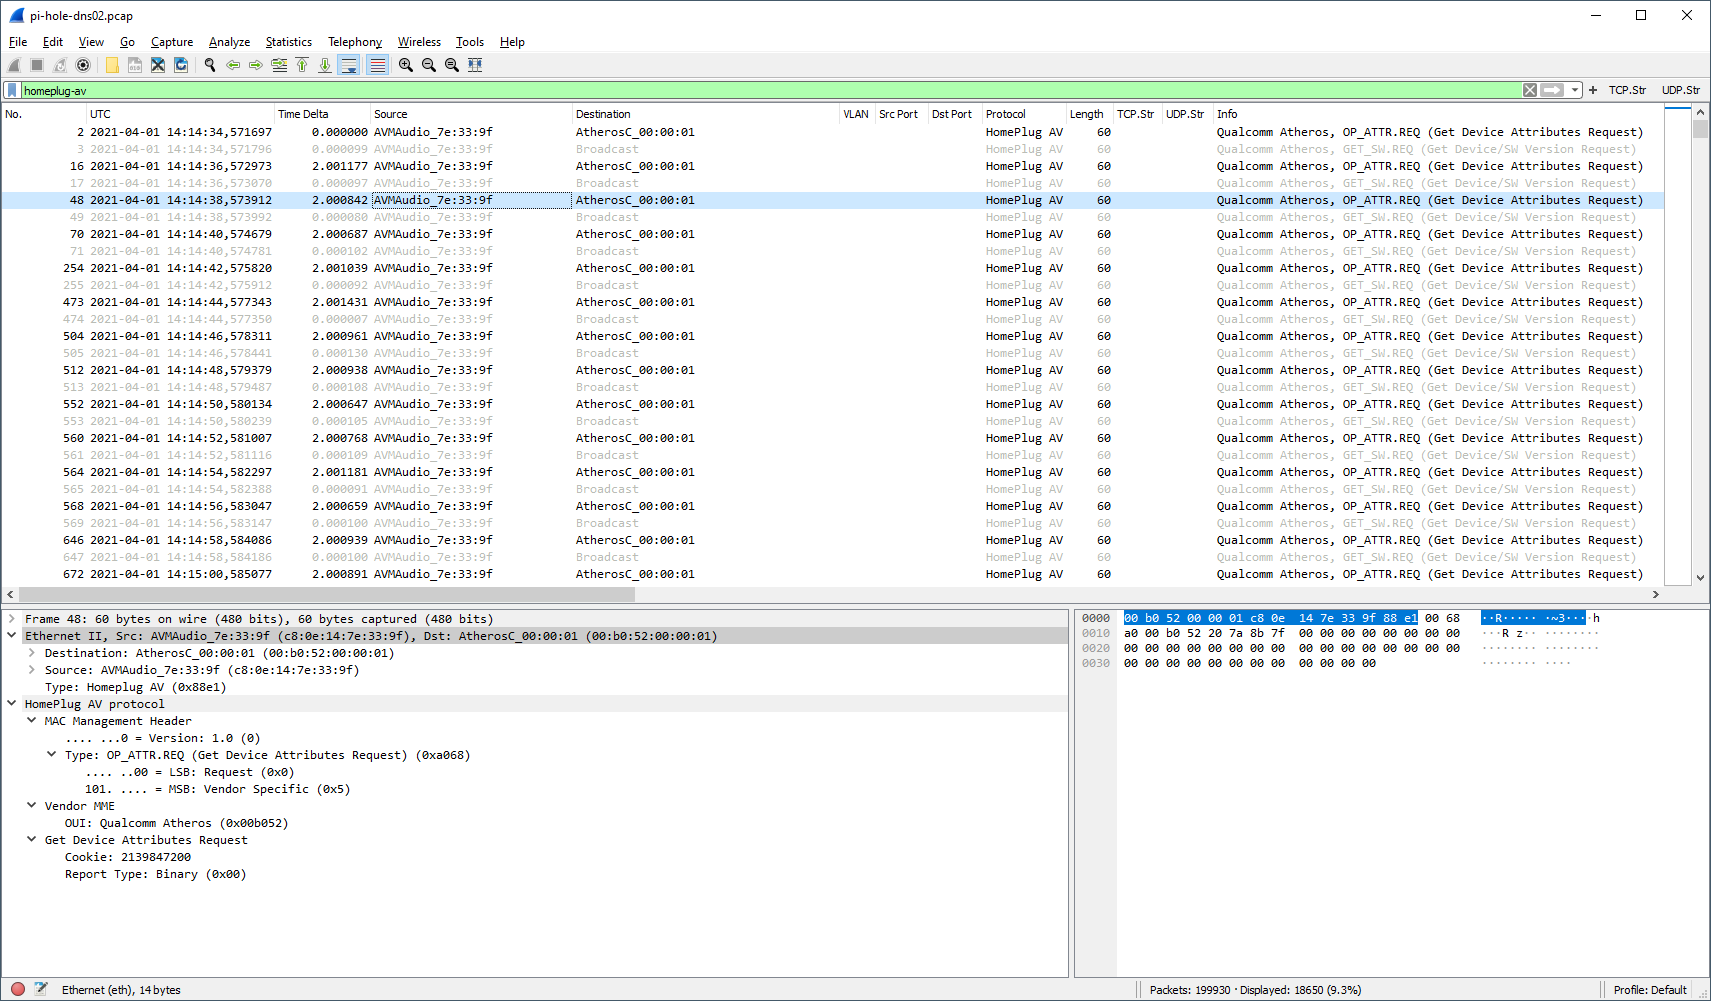
HomePlug AV
By coincidence, I encountered this “HomePlug AV” protocol on my home network. It was my home router AVM Fritzbox detecting some other powerline adapters. Wireshark has a display filter homeplug-av for it, but you can also use an EtherType based filter: eth.type == 0x88e1.

4in6
While 6in4 is a common technique for tunnel IPv6 packets through IPv4 only networks, 4in6 does it vice versa: connecting v4 islands over native v6. It’s going in the right direction. ;) It’s quite common on residential ISP connections in Germany, where native v4 is not possible anymore. They call it DS-Lite (which brings other technical problems, by the way).
Technically, 4in6 is not an own protocol (which would need an own protocol dissector within Wireshark), but normal IPv4 packets right behind an IPv6 header. Hence, the display filter is just ipv6.nxt == 4 since the Next Header field in the v6 header points to this generic “IPv4 encapsulation” with protocol number 4. The following screenshot also shows the PPPoE and PPP session as well as VLAN 7, which is the default data VLAN for Deutsche Telekom connections.

DNS RR HTTPS
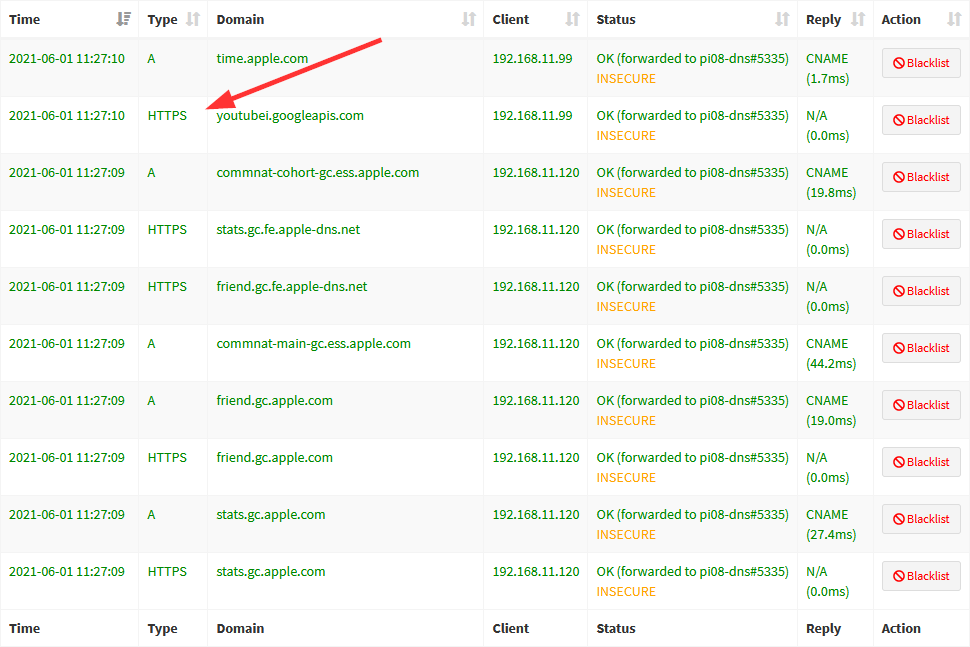
There is a draft resource record (RR) for DNS that is called “HTTPS”. To be honest, I wasn’t aware of this RR until I found many log entries in my Pi-hole for this: (Initially, I thought it’s a wrong presentation for URLs starting with HTTPS ;))
The type value for this HTTPS resource record is 65. I am not quite sure how this RR is used. It seems like my Apple devices are querying for it. Note that not every HTTPS query is answered by a corresponding HTTPS response. To find all HTTPS queries or responses, use this display filter: (dns.qry.type == 65). Looks like this: (with two custom columns, one for the query type and another for the response type)
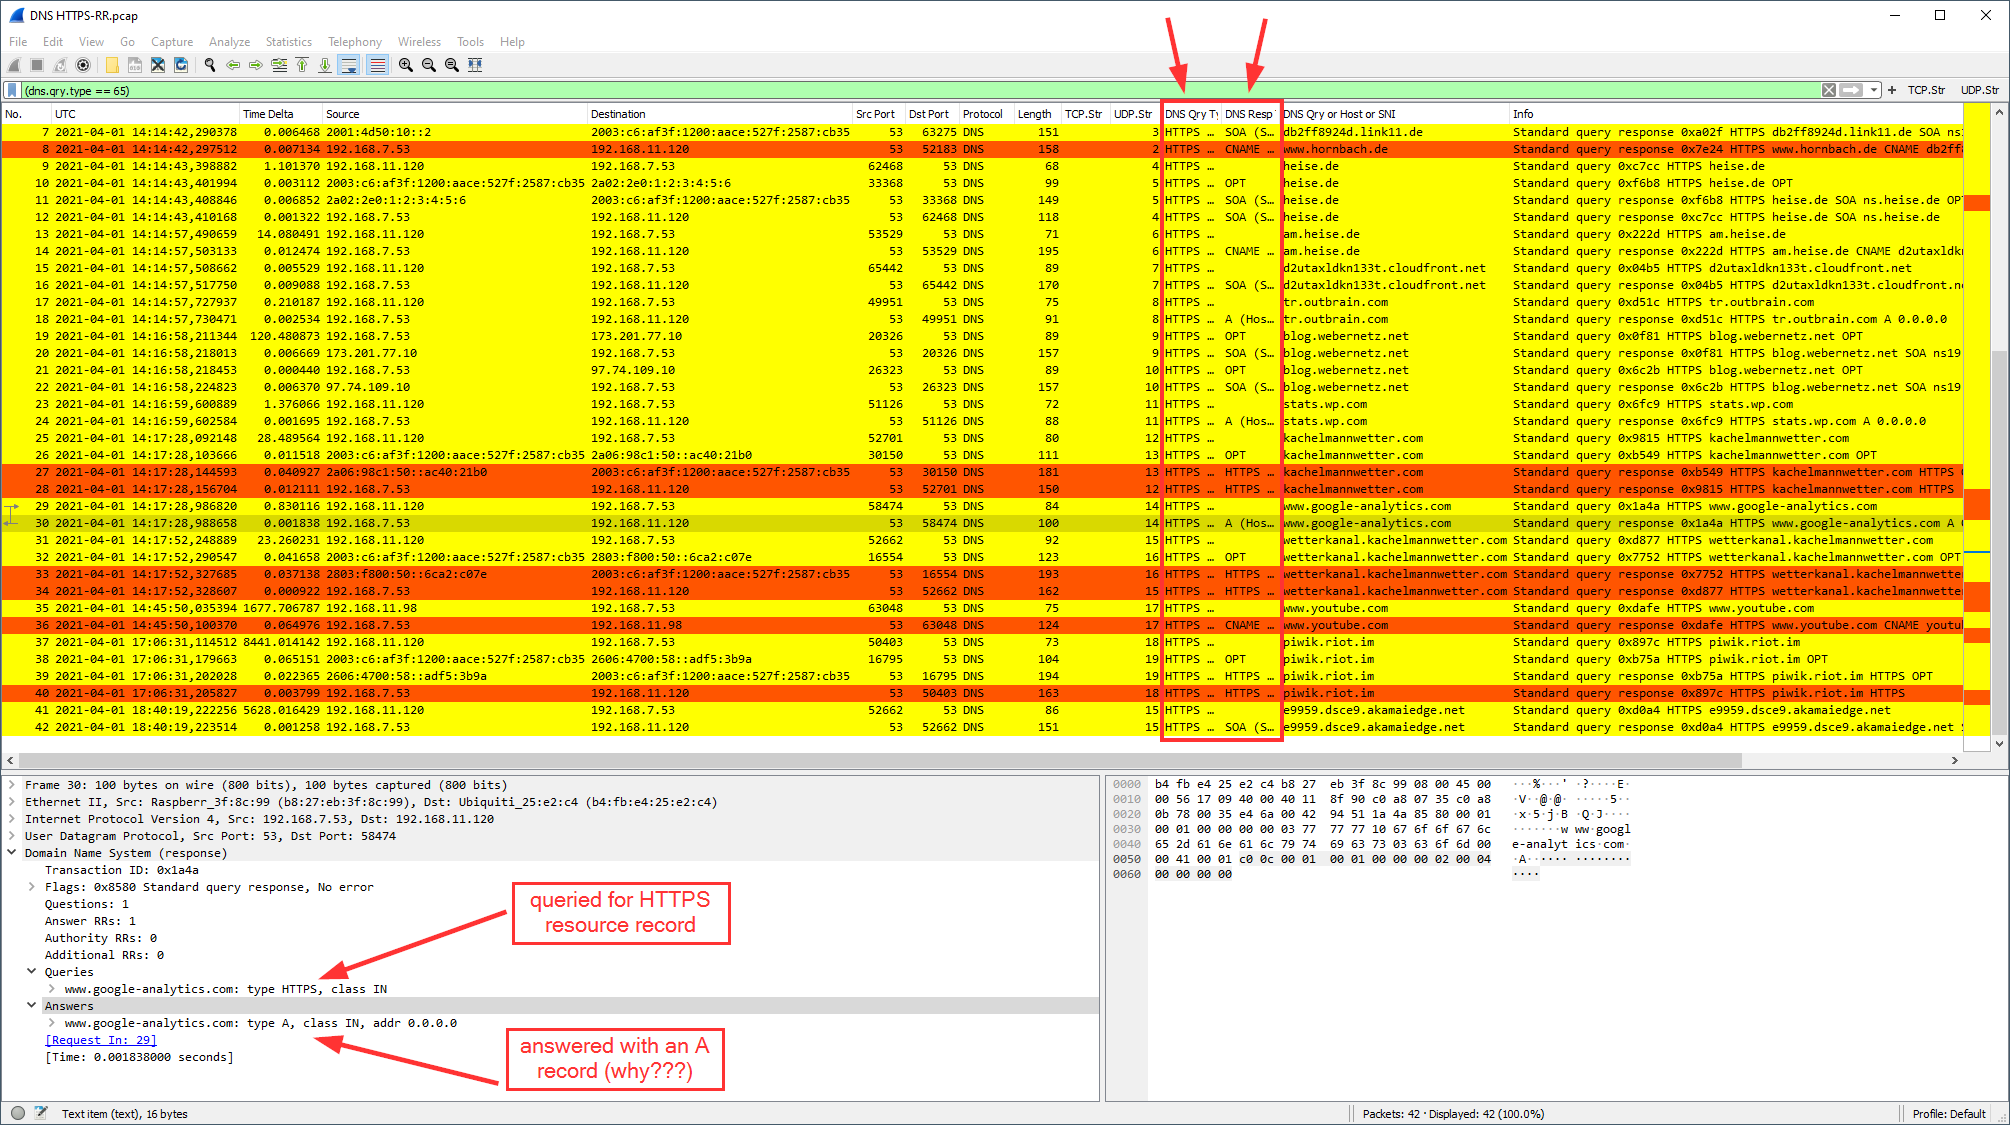
Only some responses are answering with an HTTPS RR, (dns.resp.type == 65):

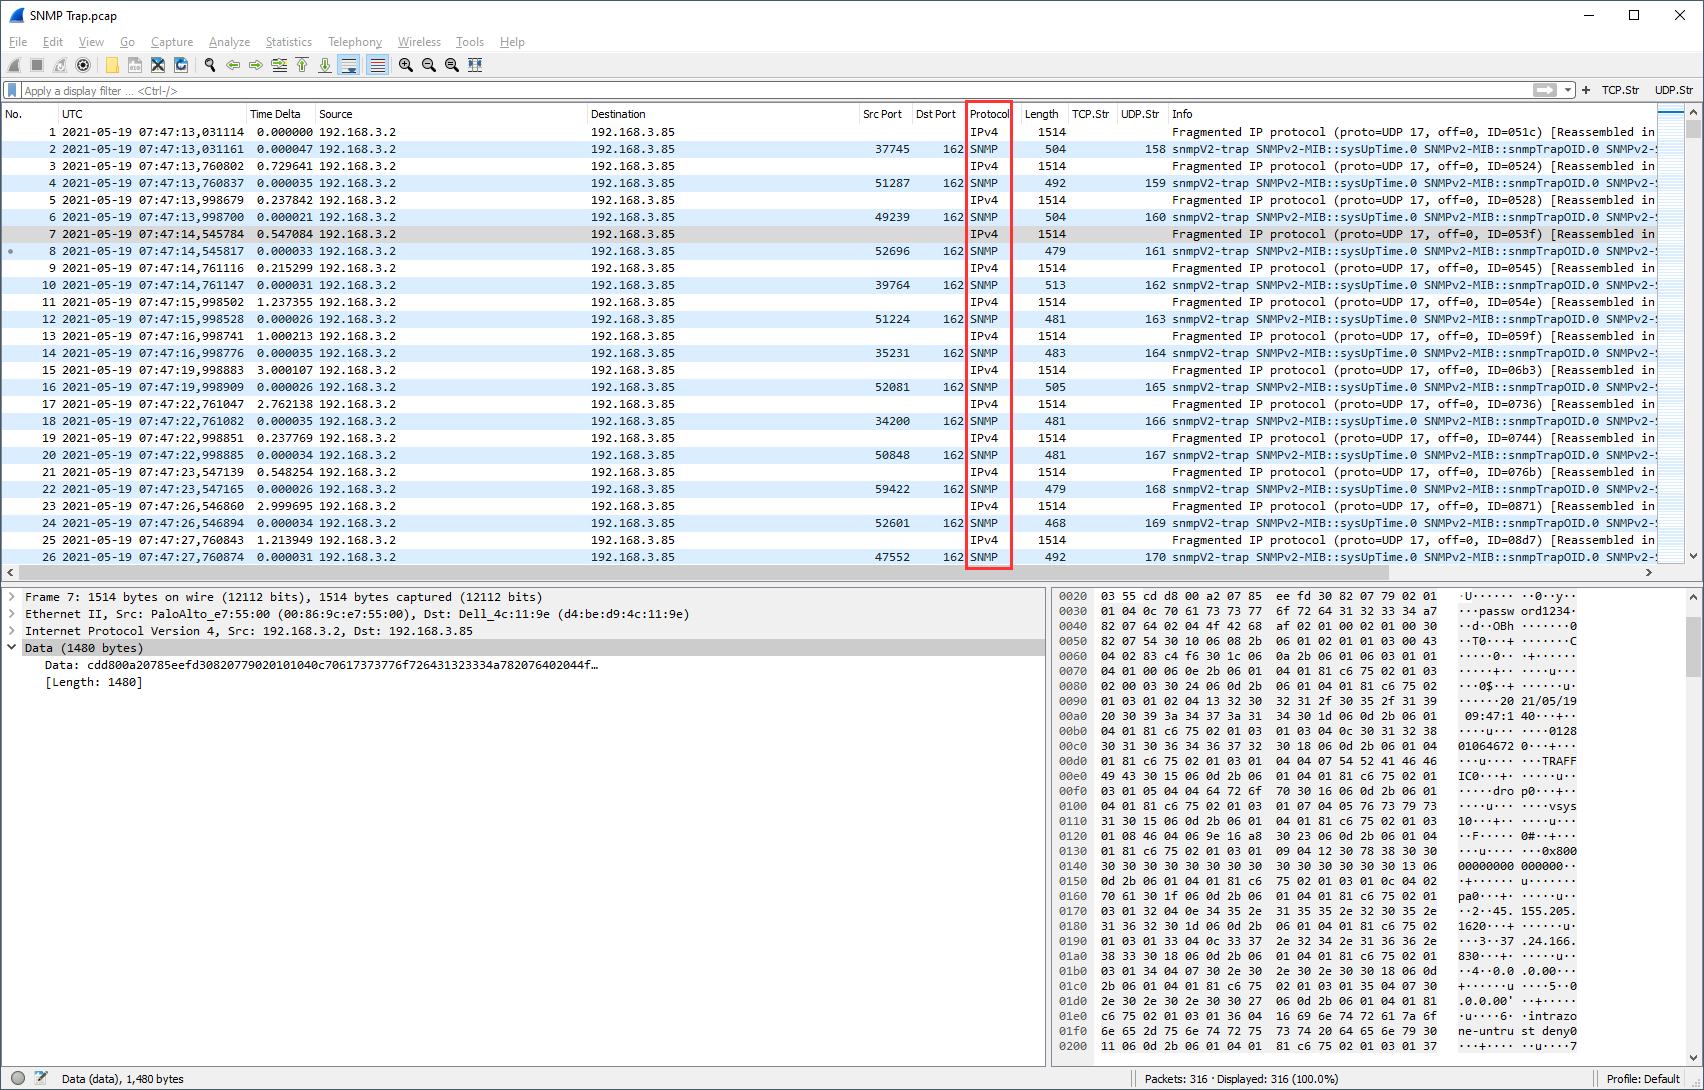
SNMP Trap
No big deal, though missing until now. Some SNMP traps, sent to UDP port 162, connectionless. Wireshark’s display filter snmp is working just like normal SNMP query/response packets on UDP port 161:

Please note that in my case the SNMP traps were a little longer than a single UDP packet, hence fragmented. And since UDP has no fragmentation (such as TCP), the fragmentation occurs at the IP layer (not recommended in general). Anyway, this is how it looks actually:

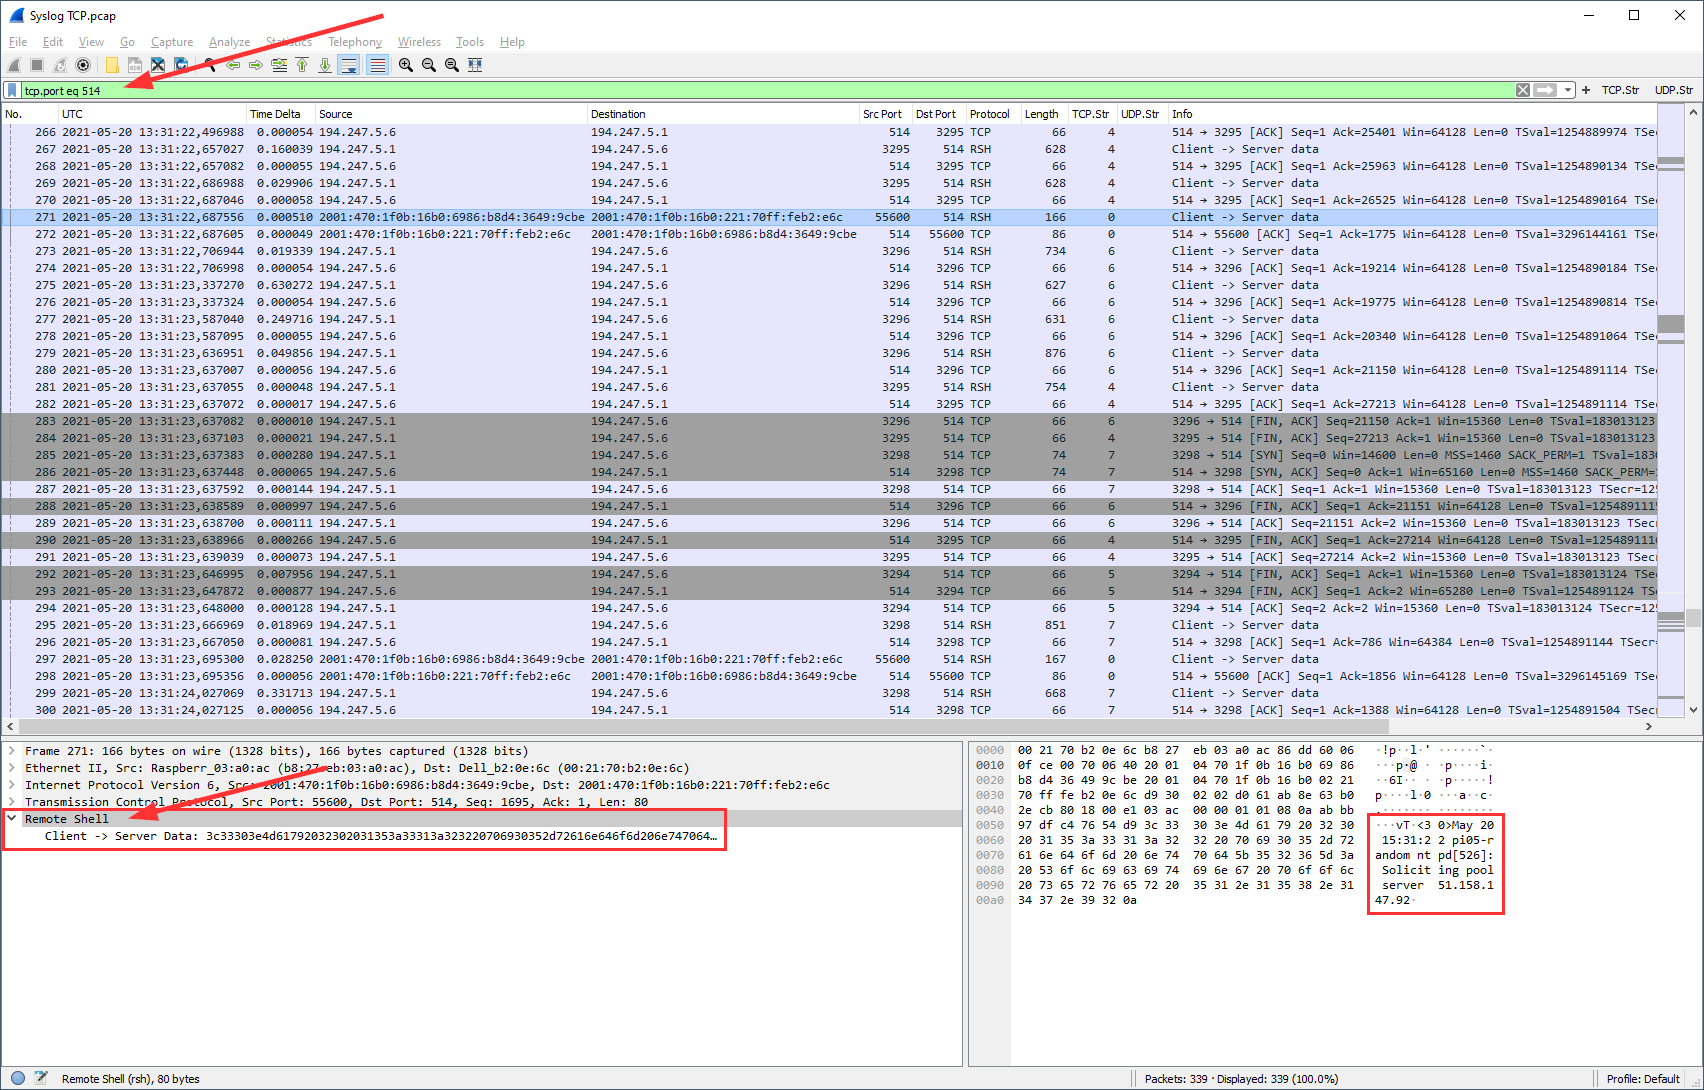
Syslog via TCP
No big deal, either. It’s a syslog logging via TCP rather than UDP. However, while the IANA lists UDP port 514 as “syslog”, TCP port 514 is listed as “shell”. Wireshark follows this, hence you can’t use syslog as the display filter but rsh for remote shell. Or you use tcp.port eq 514 to see the whole session incl. TCP overhead (recommended). The “packet bytes” section already decodes the ASCII characters, so does “Follow TCP Stream”.
In the Wireshark preferences, you could change the default port of RSH from 514 to 0 (for example) while changing the syslog TCP port to 514. This would recognize and parse the syslog messages sent over TCP.
To be honest, I am not quite sure whether 514 is the correct port for syslog over TCP at all. Some sources list TCP port 601 (RFC 3195), while others state that 514 is used mostly (RFC 6587). Anyway, Wireshark has no default TCP port for syslog at all. If you want to be conflict-free, you can use TCP port 601 for it, while setting this port as the default TCP port for syslog in Wireshark:

That is, you can use the display filter syslog again for TCP 601 sessions. And the protocol dissector works within the packet details section:

Anyway, you’ll find syslog over TCP sessions on both ports in the pcap, 514 and 601. ;)
Photo by Sharon Pittaway on Unsplash.