
Now that you’re monitoring the Linux operating system as well as the NTP server basics, it’s interesting to have a look at some more details about the DCF77 receiver. Honestly, there is only one more variable that gives a few details, namely the Clock Status Word and its Event Field. At least you have one more graph in your monitoring system. ;)
There is an event field within the clock status word that consists of these values:
- 0 nominal
- 1 no reply to poll
- 2 bad timecode format
- 3 hardware or software fault
- 4 signal loss
- 5 bad date format
- 6 bad time format
You can query this via ntpq and its “clockvar” request. Have a look at the first output line. The fourth number after “status=” is the event field, in this example a zero:
|
1 2 3 4 5 6 7 8 9 10 |
weberjoh@vm01-mrtg:/etc/mrtg$ ntpq -c clockvar ntp1.weberlab.de associd=0 status=0040 , 4 events, clk_unspec, device="RAW DCF77 CODE (Conrad DCF77 receiver module)", timecode="-#-####--#--###---M-S12--1-4p-2--1-p1----2--412---1--81---p", poll=1398, noreply=0, badformat=4, baddata=0, fudgetime1=884.000, stratum=0, refid=DCFa, flags=0, refclock_time="e03df9af.00000000 Thu, Mar 21 2019 11:53:19.000", refclock_status="TIME CODE; (LEAP INDICATION; CALLBIT)", refclock_format="RAW DCF77 Timecode", refclock_states="*NOMINAL: 1d+00:43:00 (99.54%); BAD FORMAT: 00:06:51 (0.45%); running time: 1d+00:49:51" |

Using grep ‘n sed again you can exempt this single event field id from all the others:
|
1 2 |
weberjoh@vm01-mrtg:/etc/mrtg$ ntpq -c clockvar ntp1.weberlab.de | grep associd | sed s/.*status....// | sed s/,.*// 0 |
In the end, my MRTG config for this looks like this:
|
1 2 3 4 5 6 7 8 9 10 11 12 13 14 15 16 17 |
############################################################### ################ Clock Status für DCF77 0-6 ################### ############################################################### Target[ntp1-dcf77-clockvar]: `ntpq -c clockvar ntp1.weberlab.de | grep associd | sed s/.*status....// | sed s/,.*// && echo 0` MaxBytes[ntp1-dcf77-clockvar]: 6 Title[ntp1-dcf77-clockvar]: Status Code Clockvar -- ntp1-dcf77 Options[ntp1-dcf77-clockvar]: gauge integer YLegend[ntp1-dcf77-clockvar]: Status Code Clockvar 0-6 Legend1[ntp1-dcf77-clockvar]: Status Code Legend3[ntp1-dcf77-clockvar]: Peak Status Code LegendI[ntp1-dcf77-clockvar]: Status: ShortLegend[ntp1-dcf77-clockvar]: routers.cgi*Options[ntp1-dcf77-clockvar]: fixunit nototal noo nomax routers.cgi*ShortDesc[ntp1-dcf77-clockvar]: Status DCF77 Clockvar ntp1-dcf77 #routers.cgi*WithPeak[ntp1-dcf77-clockvar]: none routers.cgi*Icon[ntp1-dcf77-clockvar]: tick-sm.gif routers.cgi*Comment[ntp1-dcf77-clockvar]: 0=nominal, 1=no reply, 2=bad timecode, 3=hard or software fault, 4=signal loss, 5=bad date, 6=bad time |
Note that I am using the “routers.cgi*Comment” option to display a single line with some comments underneath the RRD graphs:
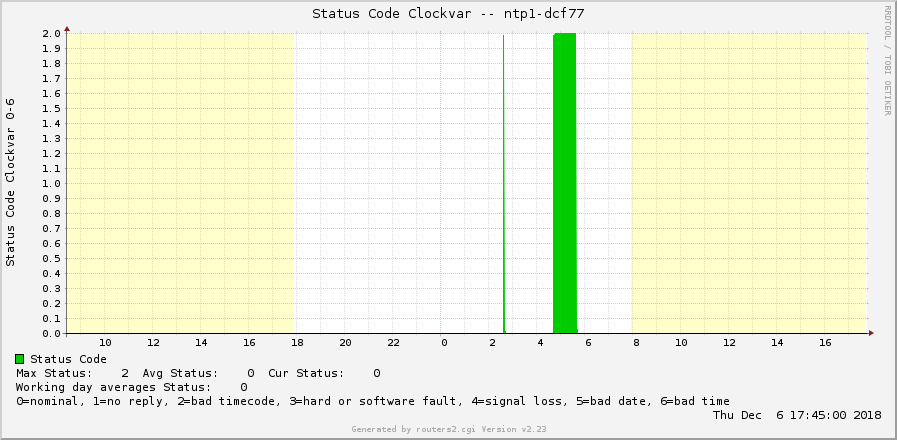
Of course, this clockvar graph correlates with other stats out of the DCF77 NTP server, such as the reach graph or the iostats. For example, I had this “bad timecode” in the above graph for about 1 hour. Similarly, the other graphs show some suspicious values as well, while you know now the actual root cause, namely “bad timecode”.
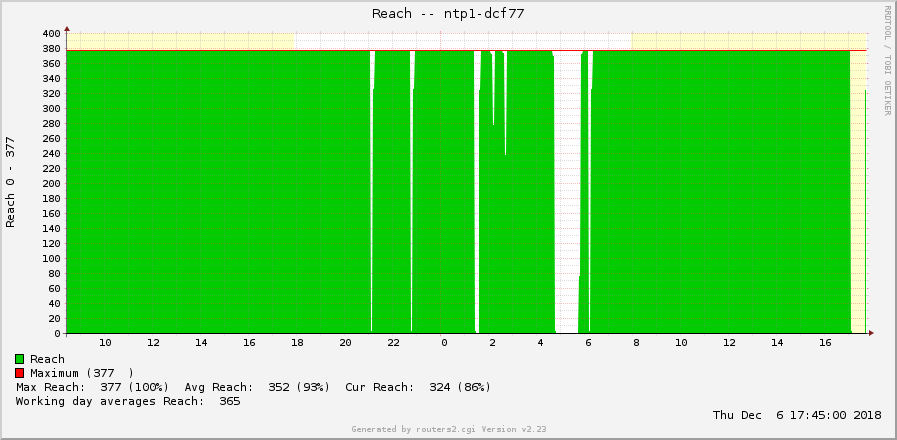

However, to be honest, I am not looking at this clockvar graph that much, since the reach already shows me whether my server is up and running or not. But, you know, because I can… ;)
Featured image “Dusty” by Thomas Hawk is licensed under CC BY-NC 2.0.