This post shortly explains the process of adding a Cisco router into the monitoring system “MRTG with Routers2” as I explained it here. It gives an example on how SNMP is activated on the router and how the *.cfg file for MRTG/Routers2 is created with the additional values for CPU and memory usage.
SNMP w/ Access-List
It is really important to not only activate SNMP on the Cisco router, but to use an ACL that allows only a few hosts (or networks) to query it via SNMP. So, the first step is to create the appropriate ACL, such as:
|
1 2 3 4 5 |
access-list 3 remark All private IPv4 addresses behind inside access-list 3 permit 10.0.0.0 0.255.255.255 access-list 3 permit 172.16.0.0 0.15.255.255 access-list 3 permit 192.168.0.0 0.0.255.255 access-list 3 deny any |
The SNMP commands then look like the following. The first command sets the community string with a read-only (RO) policy and allows only connections from an IP address that passed access-list 3.
|
1 2 3 |
snmp-server community HINefcKmWP RO 3 snmp-server location Serverraum snmp-server contact Johannes Weber |
Basic *.cfg Config File
The first step is to generate the basic *.cfg file that lists all interfaces from the router:
|
1 |
cfgmaker --snmp-options=:::::2 --show-op-down --output=fd-wv-ro01.cfg HINefcKmWP@172.16.0.1 |
Then, all “Global Config Options” can be deleted. This is because they are already specified in the basic mrtg.cfg file (if it is installed due to my tutorial in the previous post).
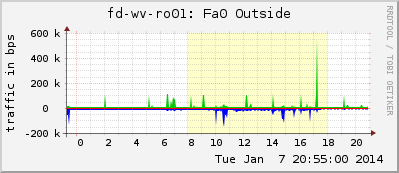
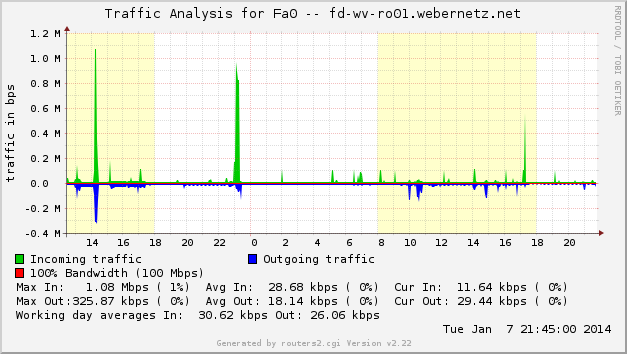
An icon that shows the common router symbol in the Routers2 overview can be set with: routers.cgi*Icon: router3-sm.gif . And the nice GryphStyle “mirror” is globally set for the whole config file (= all interfaces) with: routers.cgi*GraphStyle[_]: mirror . This produces interface graphs that look like that:
Finally, it should be verified that the MaxBytes values for all interfaces are correct.
Additional Values to Monitor
(Note that cfgmaker can also use templates with the option --host-template=cisco.htp in order to generate the CPU and memory graphs. Cisco templates can be found here. However, I am specifying them manually.)
CPU Usage
The CPU usage can be gathered by MRTG with the following lines. I like the CPU and memory graphs to be “unscaled” in which the y-axis always displays the range from 0..100 % and therefore gives a complete view. Of course, the file description [foobar] must be set correctly as well as the COMMUNITY string and the IP address:
|
1 2 3 4 5 6 7 8 9 10 11 12 13 |
############################################### CPU ################################################# #CPU usage on a 5-min avarage basis, which is the most accurate #http://www.cisco.com/en/US/tech/tk648/tk362/technologies_tech_note09186a0080094a94.shtml Target[172.16.0.1_cpu]: 1.3.6.1.4.1.9.9.109.1.1.1.1.8.1&PseudoZero:COMMUNITY@172.16.0.1:::::2 Title[172.16.0.1_cpu]: CPU Usage -- fd-wv-ro01.webernetz.net MaxBytes[172.16.0.1_cpu]: 100 Options[172.16.0.1_cpu]: gauge UnScaled[172.16.0.1_cpu]: dwmy Colours[172.16.0.1_cpu]: LIGHT YELLOW#FEED01, BLUE#0000FF, ORANGE#FF6307, VIOLET#FF00FF routers.cgi*Mode[172.16.0.1_cpu]: cpu routers.cgi*GraphStyle[172.16.0.1_cpu]: normal routers.cgi*ShortDesc[172.16.0.1_cpu]: CPU routers.cgi*InSummary[172.16.0.1_cpu]: yes |
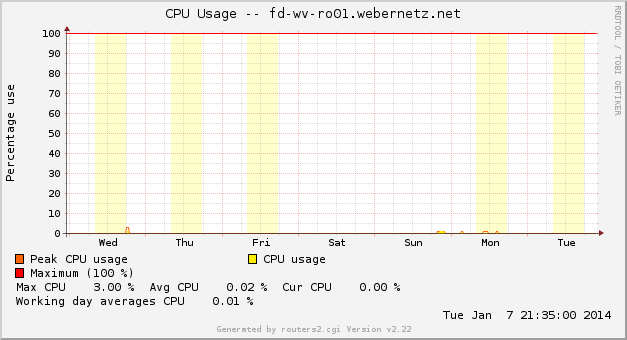
This gives a CPU graph that looks like the following. Note that my CPU usage is not that high, so there is not much color here. ;)
Memory Usage
In the same way as the CPU, the memory usage can be captured by MRTG. It is only mandatory to specify the correct MaxBytes value for the memory:
|
1 2 3 4 5 6 7 8 9 10 11 12 13 14 |
############################################### Memory ################################################# #CLI on Cisco: show memory statistics #MaxBytes = value under Processor Total(b) Target[172.16.0.1_mem]: 1.3.6.1.4.1.9.9.48.1.1.1.5.1&PseudoZero:COMMUNITY@172.16.0.1:::::2 Title[172.16.0.1_mem]: Memory Usage -- fd-wv-ro01.webernetz.net ####Specify the MaxBytes here MaxBytes[172.16.0.1_mem]: 294647400 Options[172.16.0.1_mem]: gauge UnScaled[172.16.0.1_mem]: dwmy Colours[172.16.0.1_mem]: ORANGE#FC7C01, GREEN#00CC00, DARK RED#660000, DARK GREEN#006600 routers.cgi*GraphStyle[172.16.0.1_mem]: normal routers.cgi*Options[172.16.0.1_mem]: noo routers.cgi*ShortDesc[172.16.0.1_mem]: Memory routers.cgi*InSummary[172.16.0.1_mem]: yes |
The graph will look like that:
That’s it. Go for it! ;)


