The other day I just wanted to capture some basic Linux traceroutes but ended up troubleshooting different traceroute commands and Wireshark display anomalies. Sigh. Anyway, I just added a few Linux traceroute captures – legacy and IPv6 – to the Ultimate PCAP. Here are some details:
Yep, I was shocked myself, but while I had some Windows traceroutes (based on ICMP echo-requests) and even some layer 4 traceroutes (sending TCP SYNs, e.g.) in the Ultimate PCAP, I was missing a generic Linux traceroute that uses UDP datagrams to destination ports ≥ 33434 for it. So, here we are.
Traceroute with Legacy IP
I used an Ubuntu 16.04.7 LTS (GNU/Linux 4.4.0-234-generic x86_64):
|
1 2 3 4 5 6 7 8 9 10 11 12 13 14 15 16 17 18 19 |
weberjoh@nb15-lx:~$ traceroute -V Modern traceroute for Linux, version 2.0.21 Copyright (c) 2008 Dmitry Butskoy, License: GPL v2 or any later weberjoh@nb15-lx:~$ weberjoh@nb15-lx:~$ weberjoh@nb15-lx:~$ traceroute netsec.blog traceroute to netsec.blog (5.35.226.136), 30 hops max, 60 byte packets 1 192.168.3.1 (192.168.3.1) 14.003 ms 13.960 ms 13.932 ms 2 ip-037-024-166-081.um08.pools.vodafone-ip.de (37.24.166.81) 15.423 ms 16.794 ms 15.892 ms 3 ip-178-200-118-001.um45.pools.vodafone-ip.de (178.200.118.1) 29.912 ms 33.328 ms 33.087 ms 4 ip-081-210-129-132.um21.pools.vodafone-ip.de (81.210.129.132) 32.901 ms 33.709 ms 33.813 ms 5 de-fra04d-rc1-ae-7-0.aorta.net (84.116.197.245) 41.520 ms 41.025 ms 40.964 ms 6 de-fra04c-ri1-ae15-101.aorta.net (84.116.191.6) 37.400 ms 18.572 ms 18.346 ms 7 et-7-0-0-u100.fra1-cr-polaris.bb.gdinf.net (80.81.192.239) 20.243 ms 20.314 ms 20.112 ms 8 ae0.fra10-cr-antares.bb.gdinf.net (87.230.115.1) 20.941 ms 20.509 ms 24.838 ms 9 ae2.cgn1-cr-nashira.bb.gdinf.net (87.230.114.4) 25.985 ms 26.216 ms 26.038 ms 10 ae0.100.sr-jake.cgn1.dcnet-emea.godaddy.com (87.230.114.222) 38.922 ms 38.912 ms 24.242 ms 11 * * * 12 wp367.webpack.hosteurope.de (5.35.226.136) 23.472 ms 23.407 ms 19.353 ms |
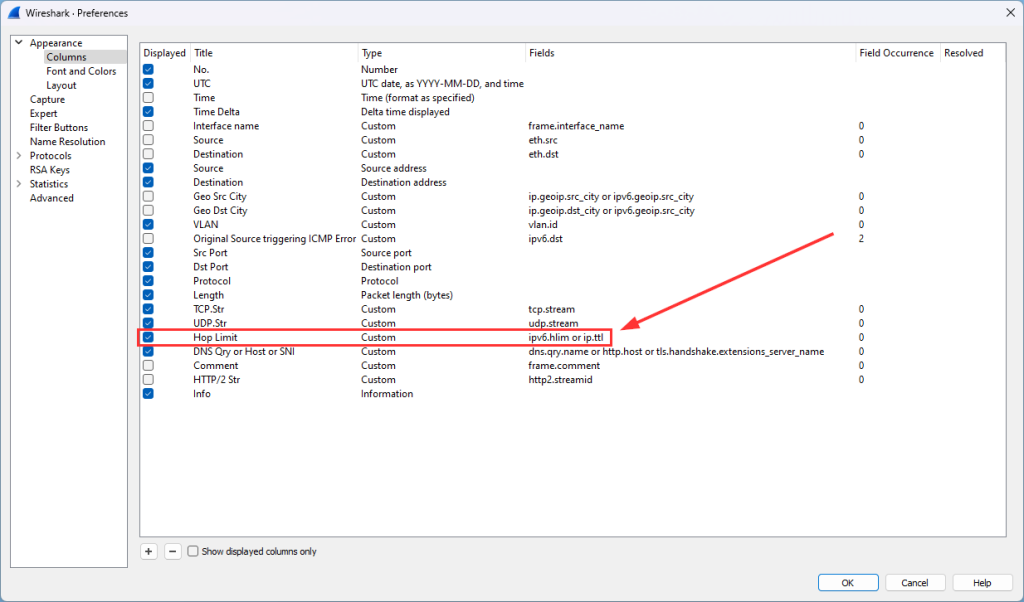
Pro-tip for Wireshark: Use a custom column which shows the hop limit (IPv6) and TTL (IPv4) in one column:
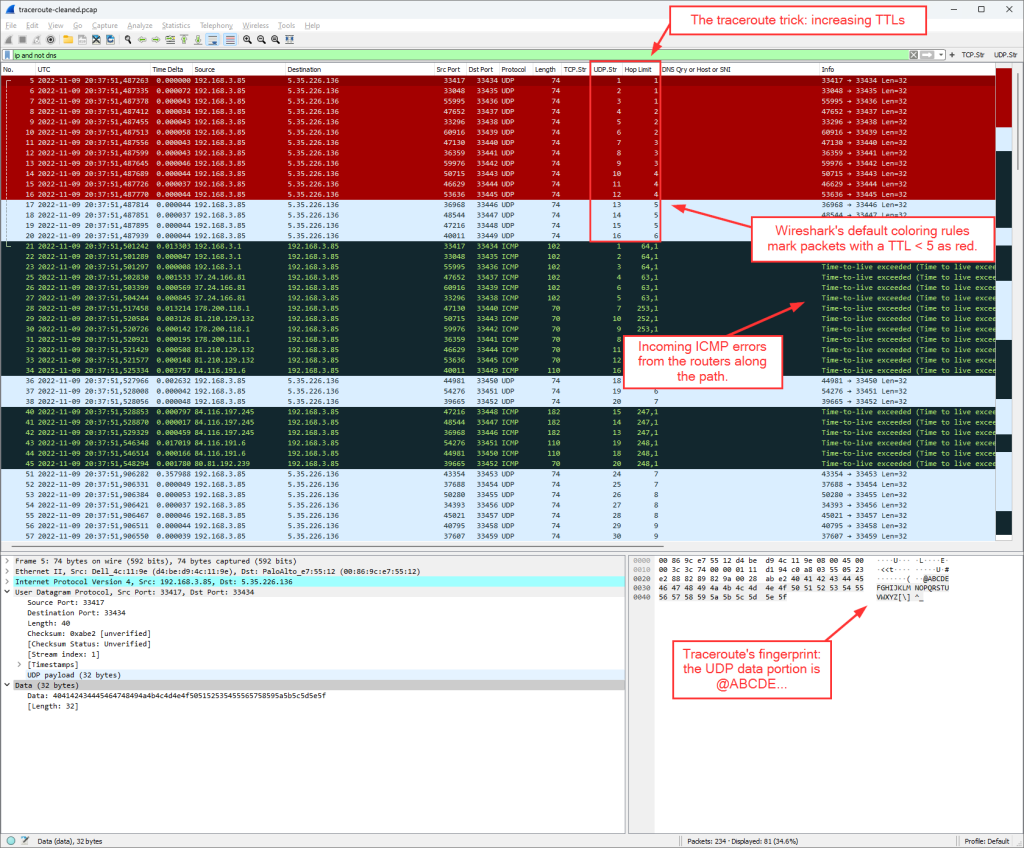
By default, traceroute sends three packets with the same hop limit/TTL starting by 1. This results in various UDP streams. At the time of writing with Wireshark version 4.0.1, the coloring of those packets is this: the first 12 UDP streams are marked red (TTL 1-4), while the other ones aren’t. (We are currently discussing the default coloring rules here at the Wireshark issues pages.) Right after it, the ICMP “time-to-live exceeded” error messages came in, while traceroute itself sent out various reverse DNS queries (omitted in the following screenshot):
This was the moment when I discovered a small bug within Wireshark (from my point of view), namely that the connecting line for ICMP errors is not working in both directions.
traceroute6 ≠ traceroute -6
Then it turned a little strange. I was always confused about which CLI command I should use for ping and/or traceroute for IPv6: traceroute6 or traceroute -6. The man page from traceroute states:
While the man page from traceroute6 states:
This is a traceroute6 call:
|
1 2 3 4 5 6 7 8 9 10 11 12 13 14 15 16 17 18 19 20 21 22 23 24 25 26 27 28 29 30 31 32 33 34 35 36 |
weberjoh@nb15-lx:~$ traceroute6 -V traceroute6 utility, iputils-s20121221 weberjoh@nb15-lx:~$ weberjoh@nb15-lx:~$ weberjoh@nb15-lx:~$ traceroute6 netsec.blog traceroute to netsec.blog (2a01:488:42:1000:50ed:8588:8a:c570) from 2001:470:7250::b15:22, 30 hops max, 24 byte packets 1 pa-dmz.weberlab.de (2001:470:7250::1) 1.058 ms 0.287 ms 0.181 ms 2 router1-fa0-1.weberlab.de (2001:470:1f0b:319::1) 0.835 ms 1.234 ms 1.036 ms 3 tunnel643592.tunnel.tserv6.fra1.ipv6.he.net (2001:470:1f0a:319::1) 14.686 ms 16.142 ms 13.943 ms 4 * * * 5 et-7-0-0-u100.fra1-cr-polaris.bb.gdinf.net (2001:7f8::5125:f1:1) 12.482 ms 10.207 ms 11.824 ms 6 ae0.fra10-cr-antares.bb.gdinf.net (2a01:488:bb03:100::3) 19.943 ms 12.124 ms 11.887 ms 7 ae2.cgn1-cr-nashira.bb.gdinf.net (2a01:488:bb02:101::2) 11.712 ms 29.159 ms 17.87 ms 8 ae0.sr-jake.cgn1.dcn.heg.com (2a01:488:bb::223) 28.083 ms 16.166 ms 16.063 ms 9 * * * 10 * * * 11 * * * 12 * * * 13 * * * 14 * * * 15 * * * 16 * * * 17 * * * 18 * * * 19 * * * 20 * * * 21 * * * 22 * * * 23 * * * 24 * * * 25 * * * 26 * * * 27 * * * 28 * * * 29 * * * 30 * * * |
(Don’t worry about the count to 30 hops for this. The destination or a firewall somewhere there is not responding, hence it counts to infinity which is 30 for traceroute.)
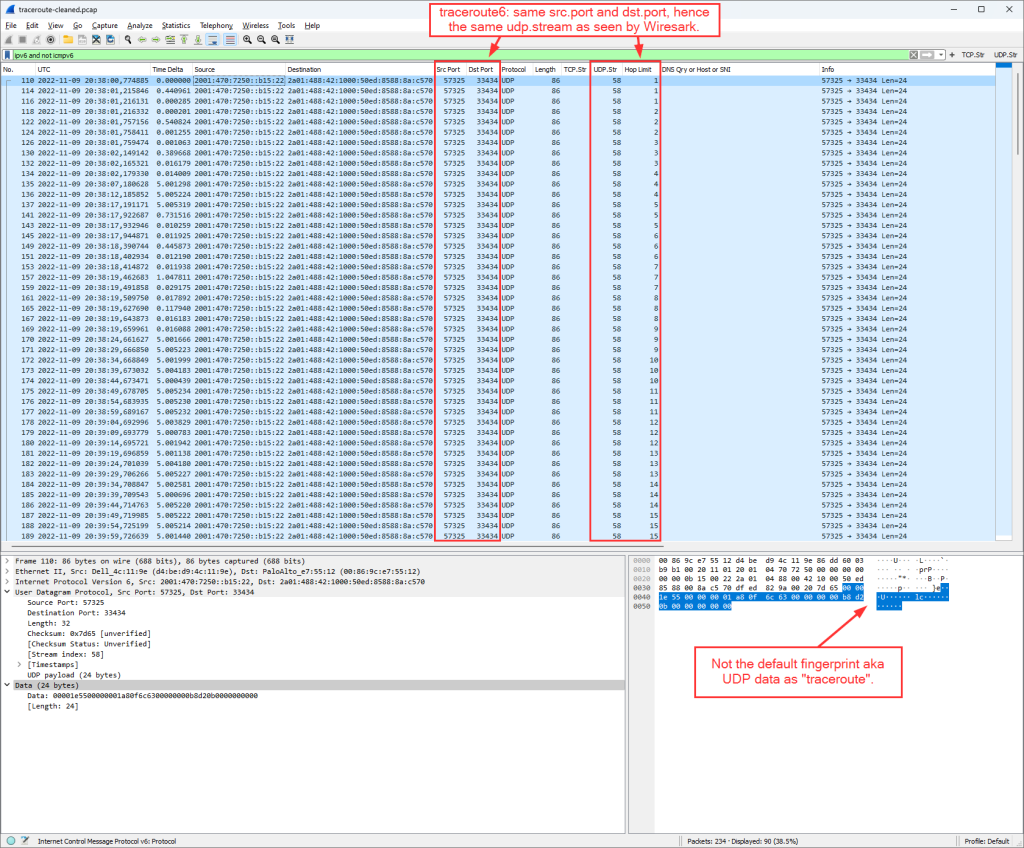
But within Wireshark, it looked like this (omitting the ICMPv6 messages here). That is: Only one static UDP destination port, hence only one UDP stream as seen by Wireshark. Furthermore, a different data portion:
(Don’t worry that no packets at all are marked red (compared to the legacy IP ones), this is part of this discussion as well. It might change with Wireshark versions > 4.0.)
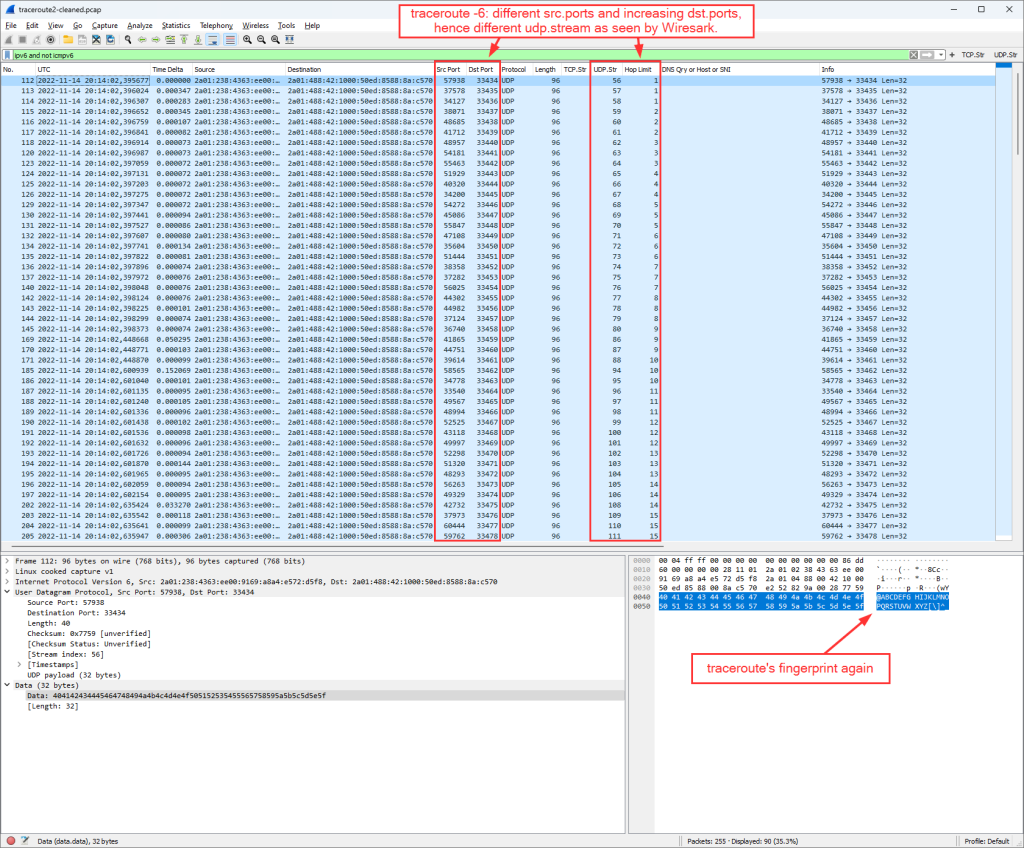
That’s why I did a traceroute -6, this time from another machine: Ubuntu 20.04.5 LTS (GNU/Linux 5.4.0 x86_64):
|
1 2 3 4 5 6 7 8 9 10 11 12 13 14 15 16 17 18 19 20 21 22 23 24 25 26 27 28 29 30 31 32 33 34 35 36 37 |
weberjoh@h2877111:~$ traceroute -V Modern traceroute for Linux, version 2.1.0 Copyright (c) 2016 Dmitry Butskoy, License: GPL v2 or any later weberjoh@h2877111:~$ weberjoh@h2877111:~$ weberjoh@h2877111:~$ traceroute -6 netsec.blog traceroute to netsec.blog (2a01:488:42:1000:50ed:8588:8a:c570), 30 hops max, 80 byte packets 1 * * * 2 491.ae12.core-b1.as6724.net (2a01:238:b:105::1) 0.285 ms 0.271 ms 0.210 ms 3 110.ae14.bb-rt1-2.h20.r22.rs.ber.de.as6724.net (2a01:238:b:3901::1) 0.400 ms 0.343 ms 110.ae13.bb-rt1-1.e18.r23.rs.ber.de.as6724.net (2a01:238:b:3801::1) 0.537 ms 4 ae-0-88.bb-a.ak.ber.de.oneandone.net (2001:8d8:0:3::99) 0.852 ms 0.817 ms ae-1-88.bb-a.ak.ber.de.oneandone.net (2001:8d8:0:3::a1) 0.799 ms 5 ae-13.bb-a.tp.kae.de.net.ionos.com (2001:8d8:0:2::1d2) 14.510 ms 14.451 ms 14.365 ms 6 ae-2.bb-b.bs.kae.de.net.ionos.com (2001:8d8:0:5::4) 16.837 ms 16.863 ms 16.871 ms 7 ae-9.bb-b.fr7.fra.de.net.ionos.com (2001:8d8:0:2::11e) 16.884 ms 16.905 ms 16.964 ms 8 et-7-0-0-u100.fra1-cr-polaris.bb.gdinf.net (2001:7f8::5125:f1:1) 16.417 ms 16.441 ms 16.403 ms 9 ae0.fra10-cr-antares.bb.gdinf.net (2a01:488:bb03:100::3) 17.188 ms 17.259 ms 17.183 ms 10 ae2.cgn1-cr-nashira.bb.gdinf.net (2a01:488:bb02:101::2) 19.992 ms 19.405 ms 19.340 ms 11 ae0.sr-jake.cgn1.dcn.heg.com (2a01:488:bb::223) 59.756 ms 59.678 ms 59.631 ms 12 * * * 13 * * * 14 * * * 15 * * * 16 * * * 17 * * * 18 * * * 19 * * * 20 * * * 21 * * * 22 * * * 23 * * * 24 * * * 25 * * * 26 * * * 27 * * * 28 * * * 29 * * * 30 * * * |
Which now looks more familiar compared to the traceroute for legacy IP:
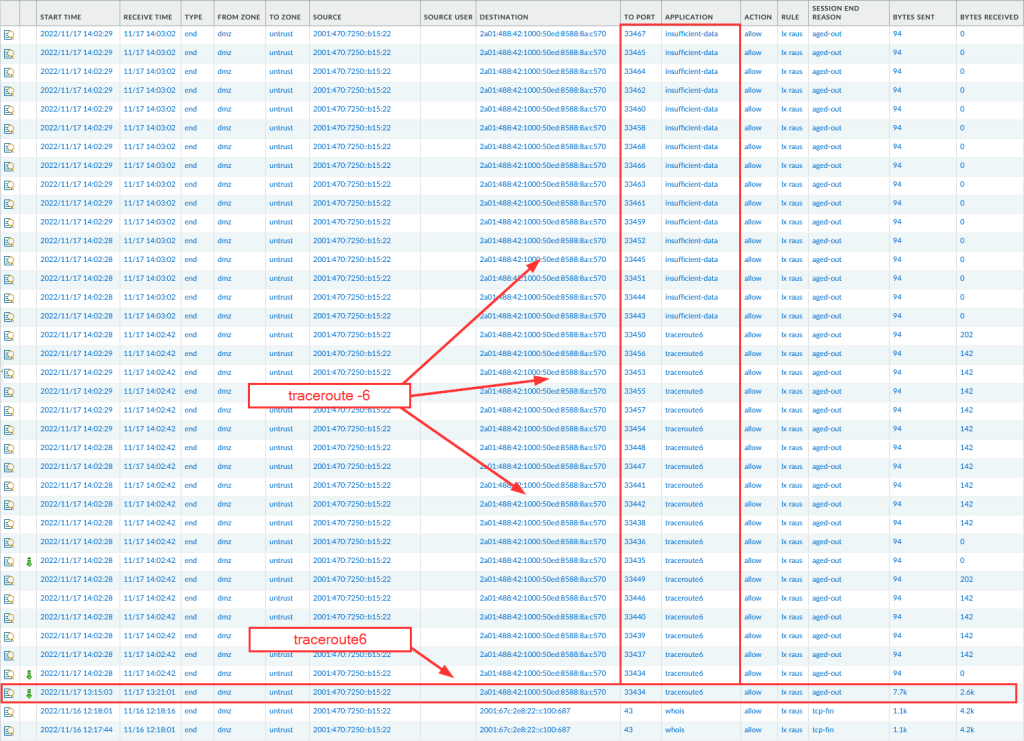
By the way: This is what the traffic log from a Palo Alto Networks NGFW looks like for those two tools:
Anyway, those traceroutes are now within the Ultimate PCAP along with the ICMPv6/ICMP errors coming back and the DNS queries made by those traceroute tools. Thus you can investigate them by yourself. Note that those Linux traceroutes are not a protocol by themselves, hence there is no direct display filter. You can use something like this:
|
1 |
udp.dstport in { 33434 .. 33534 } and ( ip.ttl < 31 || ipv6.hlim < 31 ) |
Want to join the discussion?
Some tweets about those investigations during the last weeks:
In #DualStack environments, traceroute will use legacy IP primarily. AHHH. Why?!? #IPv6 pic.twitter.com/shLuS1n1aZ
— Johannes Weber 🎸 (@webernetz) October 21, 2022
Ouch! The man page states "traceroute6 is equivalent to traceroute -6" and it's NOT! While "traceroute6" sends all datagrams to the same dst.port (same stream), "traceroute -6" sends each datagram to an increased dst.port (different streams). Different tools! #IPv6 #details pic.twitter.com/2k3qD6KpQj
— Johannes Weber 🎸 (@webernetz) November 14, 2022
Yeah, that happens to me when I “just want to have a short look at something”. ?
Photo by Nick Seagrave on Unsplash.




Hi Johannes,
danke für den Beitrag. Sehr interessant, dass es doch einen Unterschied gibt. Ähnlich überrascht war ich das erste Mal, als ich feststellte, dass Linux UDP benutzt. :-)
LG Lukas